Template:Estimating equation using the cw: Difference between revisions
| Line 15: | Line 15: | ||
Weibull++'s Comparison Wizard allows you to perform such calculations. The disadvantage of this method is that the sample sizes are not taken into account, thus one should avoid using this method of comparison when the sample sizes are different. | Weibull++'s Comparison Wizard allows you to perform such calculations. The disadvantage of this method is that the sample sizes are not taken into account, thus one should avoid using this method of comparison when the sample sizes are different. | ||
'''Example 2:''' | |||
{{Example: Life Comparison-Compare Two Designs Using Comparison Wizard}} | |||
Revision as of 22:30, 27 February 2012
Estimating [math]\displaystyle{ P\left[ {{t}_{2}}\ge {{t}_{1}} \right] }[/math] Using the Comparison Wizard
Another methodology, suggested by Gerald G. Brown and Herbert C. Rutemiller, is to estimate the probability of whether the times-to-failure of one population are better or worse than the times-to-failure of the second. The equation used to estimate this probability is given by:
- [math]\displaystyle{ P\left[ {{t}_{2}}\ge {{t}_{1}} \right]=\mathop{}_{0}^{\infty }{{f}_{1}}(t)\cdot {{R}_{2}}(t)\cdot dt }[/math]
where [math]\displaystyle{ {{f}_{1}}(t) }[/math] is the [math]\displaystyle{ pdf }[/math] of the first distribution and [math]\displaystyle{ {{R}_{2}}(t) }[/math] is the reliability function of the second distribution. The evaluation of the superior data set is based on whether this probability is smaller or greater than 0.5. If the probability is equal to 0.5, that is equivalent to saying the two distributions are identical.
If given two alternate designs with life test data, where X and Y represent the life test data from two different populations, and if we simply wanted to choose the component at time [math]\displaystyle{ t }[/math] with the higher reliability, one choice would be to select the component with the higher reliability at time [math]\displaystyle{ t }[/math] . However, if we wanted to design a product as long-lived as possible, we would want to calculate the probability that the entire distribution of one product is better than the other and choose X or Y when this probability is above or below 0.50 respectively.
The statement that the probability that X is greater or equal to Y can be interpreted as follows:
- • If [math]\displaystyle{ P=0.50 }[/math] , then the statement is equivalent to saying that both X and Y are equal.
- • If [math]\displaystyle{ P\lt 0.50 }[/math] or, for example, [math]\displaystyle{ P=0.10 }[/math] , then the statement is equivalent to saying that [math]\displaystyle{ P=1-0.10=0.90 }[/math] , or Y is better than X with a 90% probability.
Weibull++'s Comparison Wizard allows you to perform such calculations. The disadvantage of this method is that the sample sizes are not taken into account, thus one should avoid using this method of comparison when the sample sizes are different.
Example 2:
Using the Life Comparison Tool to Compare Two Designs
Using the same data set from the contour plot example, use Weibull++'s Life Comparison tool to estimate the probability that the units from the new design will outlast the units from the old design.
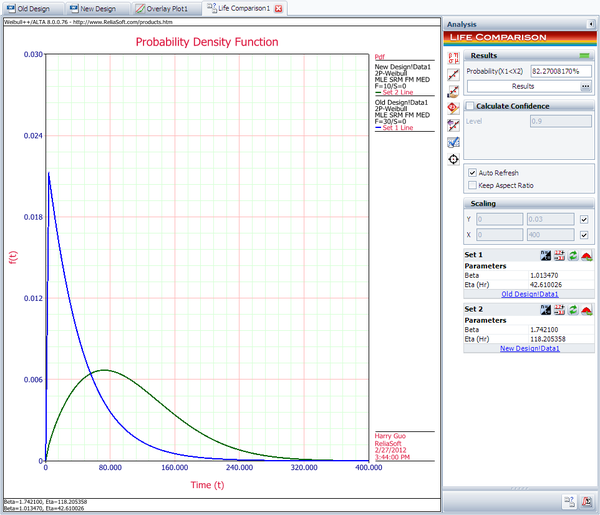
First, enter the data sets into two separate Weibull++ standard folios (or two separate data sheets within the same folio) and analyze the data sets using the two-parameter Weibull distribution and maximum likelihood estimation (MLE) method. Next, open the Life Comparison tool and select to compare the two data sets. The next figure shows the pdf curves and the result of the comparison.
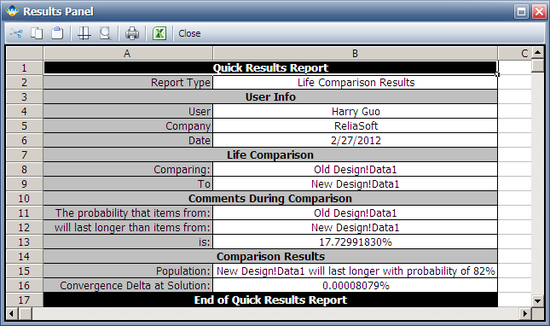
The comparison summary is given in the Results Panel window.

