Template:Example:CD-GLL Weibull: Difference between revisions
(Created page with '===CD GLL-Weibull Example=== <br> A sample of 18 units of an electronic component was subjected to temperature and voltage stresses. The temperature was initially set 100K and wa…') |
|||
| Line 1: | Line 1: | ||
==CD GLL-Weibull Example== | |||
<br> | <br> | ||
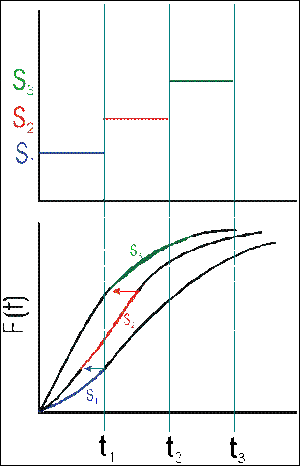
A sample of 18 units of an electronic component was subjected to temperature and voltage stresses. The temperature was initially set 100K and was then continuously increased to 200K over a period of 20 hours. The temperature was again increased at 120 hours to 300K over a 20 hours period as shown in Fig. 3. The voltage was initially set 4V and was then increased continuously to 8V over a period of 10 hours. The voltage was again increased at 110 hours to 12V over a 10 hours period as shown in Fig. 4. | A sample of 18 units of an electronic component was subjected to temperature and voltage stresses. The temperature was initially set 100K and was then continuously increased to 200K over a period of 20 hours. The temperature was again increased at 120 hours to 300K over a 20 hours period as shown in Fig. 3. The voltage was initially set 4V and was then increased continuously to 8V over a period of 10 hours. The voltage was again increased at 110 hours to 12V over a 10 hours period as shown in Fig. 4. | ||
Revision as of 17:24, 22 February 2012
CD GLL-Weibull Example
A sample of 18 units of an electronic component was subjected to temperature and voltage stresses. The temperature was initially set 100K and was then continuously increased to 200K over a period of 20 hours. The temperature was again increased at 120 hours to 300K over a 20 hours period as shown in Fig. 3. The voltage was initially set 4V and was then increased continuously to 8V over a period of 10 hours. The voltage was again increased at 110 hours to 12V over a 10 hours period as shown in Fig. 4.
- [math]\displaystyle{ }[/math]
The failure times, as entered in ALTA PRO, are shown in the next figure.
The stresses are transformed using an Arrhenius life-stress relationship for temperature, a Power Law life-stress reliationship for voltage and the Weibull distribution as the underlying distribution.
- [math]\displaystyle{ }[/math]
The estimated model parameters are shown next.
- [math]\displaystyle{ \begin{align} & \widehat{\beta }= & 3.5073 \\ & \widehat{{{\alpha }_{0}}}= & -1.3773 \\ & \widehat{{{\alpha }_{1}}}= & 450.46 \\ & \widehat{{{\alpha }_{2}}}= & 1.98 \end{align} }[/math]
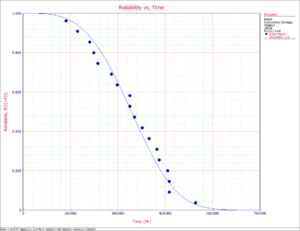
The use level (temperature = 100K, voltage = 4V) reliability plot is shown in the next figure.


