Template:Effect of beta on the cdf: Difference between revisions
Jump to navigation
Jump to search
No edit summary |
No edit summary |
||
| Line 1: | Line 1: | ||
'''The Effect of <span class="texhtml">β</span> on the <math>cdf</math> and Reliability Function | '''The Effect of <span class="texhtml">β</span> on the <math>cdf</math> and Reliability Function''' | ||
Revision as of 21:41, 9 February 2012
The Effect of β on the [math]\displaystyle{ cdf }[/math] and Reliability Function
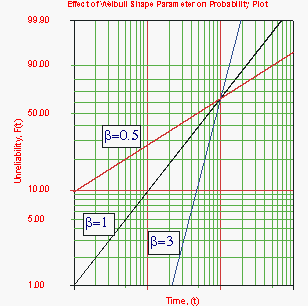
The above Figure shows the effect of the value of β on the [math]\displaystyle{ cdf }[/math], as manifested in the Weibull probability plot. It is easy to see why this parameter is sometimes referred to as the slope. Note that the models represented by the three lines all have the same value of η. Figure 6-3 shows the effects of these varied values of β on the reliability plot, which is a linear analog of the probability plot.
- R(t) decreases sharply and monotonically for 0 < β < 1 and is convex.
- For β = 1, R(t) decreases monotonically but less sharply than for 0 < β < 1 and is convex.
- For β > 1, R(t) decreases as increases. As wear-out sets in, the curve goes through an inflection point and decreases sharply.

