Template:Ald characteristics: Difference between revisions
Jump to navigation
Jump to search
(Created page with '===Characteristics=== :• The lognormal distribution is a distribution skewed to the right. :• The <math>pdf</math> starts at zero, increases to its mode, and decreases ther…') |
Chris Kahn (talk | contribs) |
||
| Line 1: | Line 1: | ||
===Characteristics=== | ===Characteristics=== | ||
: | :* The lognormal distribution is a distribution skewed to the right. | ||
: | :* The <math>pdf</math> starts at zero, increases to its mode, and decreases thereafter. | ||
<br> | <br> | ||
[[Image:chp4pdf.gif|thumb|center|300px|''Pdf'' of the lognormal distribution.]] | [[Image:chp4pdf.gif|thumb|center|300px|''Pdf'' of the lognormal distribution.]] | ||
<br> | <br> | ||
<br> | <br> | ||
The characteristics of the lognormal distribution can be exemplified by examining the two parameters, the log-mean | The characteristics of the lognormal distribution can be exemplified by examining the two parameters, the log-mean <math>({{\overline{T}}^{\prime }})</math> and the log-std (<math>{{\sigma }_{{{T}'}}}</math>), and the effect they have on the <math>pdf</math>. | ||
<br> | <br> | ||
Looking at the Log-Mean <math>({{\overline{T}}^{\prime }})</math> | '''Looking at the Log-Mean''' <math>({{\overline{T}}^{\prime }})</math> | ||
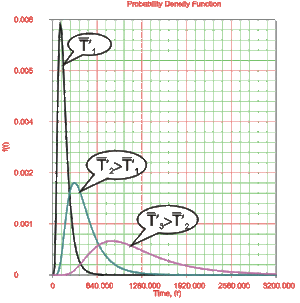
: | :* The parameter, <math>\bar{{T}'}</math>, or the log-mean life, or the <math>MTT{F}'</math> in terms of the logarithm of the <math>{T}'s</math> is also the scale parameter and a unitless number. | ||
: | :* For the same <math>{{\sigma }_{{{T}'}}}</math> the <math>pdf</math> 's skewness increases as <math>\bar{{T}'}</math> increases. | ||
<br> | <br> | ||
<br> | <br> | ||
| Line 18: | Line 18: | ||
====Looking at the Log-STD <math>({{\sigma }_{{{T}'}}})</math>==== | ====Looking at the Log-STD <math>({{\sigma }_{{{T}'}}})</math>==== | ||
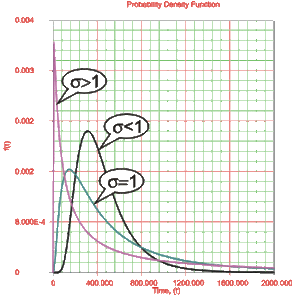
: | :* The parameter <math>{{\sigma }_{{{T}'}}}</math>, or the standard deviation of the <math>{T}'s</math> in terms of their logarithm or of their <math>{T}'</math>, is also the shape parameter, and not the scale parameter as in the normal <math>pdf</math>. It is a unitless number and assumes only positive values. | ||
: | :* The degree of skewness increases as <math>{{\sigma }_{{{T}'}}}</math> increases, for a given <math>\bar{{T}'}</math>. | ||
: | :* For <math>{{\sigma }_{{{T}'}}}</math> values significantly greater than 1, the <math>pdf</math> rises very sharply in the beginning (i.e., for very small values of <math>T</math> near zero), and essentially follows the ordinate axis, peaks out early, and then decreases sharply like an exponential <math>pdf</math> or a Weibull <math>pdf</math> with <math>0<\beta <1</math>. | ||
<br> | <br> | ||
[[Image:chp4pdf3.gif|thumb|center|300px|''Pdf'' of the lognormal distribution with different log-std values.]] | [[Image:chp4pdf3.gif|thumb|center|300px|''Pdf'' of the lognormal distribution with different log-std values.]] | ||
<br> | <br> | ||
Revision as of 17:32, 7 March 2012
Characteristics
- The lognormal distribution is a distribution skewed to the right.
- The [math]\displaystyle{ pdf }[/math] starts at zero, increases to its mode, and decreases thereafter.
The characteristics of the lognormal distribution can be exemplified by examining the two parameters, the log-mean [math]\displaystyle{ ({{\overline{T}}^{\prime }}) }[/math] and the log-std ([math]\displaystyle{ {{\sigma }_{{{T}'}}} }[/math]), and the effect they have on the [math]\displaystyle{ pdf }[/math].
Looking at the Log-Mean [math]\displaystyle{ ({{\overline{T}}^{\prime }}) }[/math]
- The parameter, [math]\displaystyle{ \bar{{T}'} }[/math], or the log-mean life, or the [math]\displaystyle{ MTT{F}' }[/math] in terms of the logarithm of the [math]\displaystyle{ {T}'s }[/math] is also the scale parameter and a unitless number.
- For the same [math]\displaystyle{ {{\sigma }_{{{T}'}}} }[/math] the [math]\displaystyle{ pdf }[/math] 's skewness increases as [math]\displaystyle{ \bar{{T}'} }[/math] increases.
Looking at the Log-STD [math]\displaystyle{ ({{\sigma }_{{{T}'}}}) }[/math]
- The parameter [math]\displaystyle{ {{\sigma }_{{{T}'}}} }[/math], or the standard deviation of the [math]\displaystyle{ {T}'s }[/math] in terms of their logarithm or of their [math]\displaystyle{ {T}' }[/math], is also the shape parameter, and not the scale parameter as in the normal [math]\displaystyle{ pdf }[/math]. It is a unitless number and assumes only positive values.
- The degree of skewness increases as [math]\displaystyle{ {{\sigma }_{{{T}'}}} }[/math] increases, for a given [math]\displaystyle{ \bar{{T}'} }[/math].
- For [math]\displaystyle{ {{\sigma }_{{{T}'}}} }[/math] values significantly greater than 1, the [math]\displaystyle{ pdf }[/math] rises very sharply in the beginning (i.e., for very small values of [math]\displaystyle{ T }[/math] near zero), and essentially follows the ordinate axis, peaks out early, and then decreases sharply like an exponential [math]\displaystyle{ pdf }[/math] or a Weibull [math]\displaystyle{ pdf }[/math] with [math]\displaystyle{ 0\lt \beta \lt 1 }[/math].


