Template:Mixed data camsaa-cd: Difference between revisions
(Created page with '===Mixed Data=== <br> In the RGA Software, the Discrete Data > Mixed Data option gives a data sheet that can have input data that is either configuration in groups or individual …') |
Lisa Hacker (talk | contribs) |
||
| Line 3: | Line 3: | ||
In the RGA Software, the Discrete Data > Mixed Data option gives a data sheet that can have input data that is either configuration in groups or individual trial by trial, or a mixed combination of individual trials and configurations of more than one trial. The calculations use the same mathematical methods described in section 5.3 for the Crow-AMSAA grouped data. | In the RGA Software, the Discrete Data > Mixed Data option gives a data sheet that can have input data that is either configuration in groups or individual trial by trial, or a mixed combination of individual trials and configurations of more than one trial. The calculations use the same mathematical methods described in section 5.3 for the Crow-AMSAA grouped data. | ||
<br> | <br> | ||
====Example==== | |||
<br> | <br> | ||
Table 5.7 shows the number of fai | Table 5.7 shows the number of fai | ||
Revision as of 12:38, 23 August 2012
Mixed Data
In the RGA Software, the Discrete Data > Mixed Data option gives a data sheet that can have input data that is either configuration in groups or individual trial by trial, or a mixed combination of individual trials and configurations of more than one trial. The calculations use the same mathematical methods described in section 5.3 for the Crow-AMSAA grouped data.
Example
Table 5.7 shows the number of fai
[math]\displaystyle{ \widehat{\beta }=0.7950 }[/math]
lures of each interval of trials and the cumulative number of trials in each interval for a reliability growth test. For example, the first row of Table 5.7 indicates that for an interval of 14 trials, 5 failures occurred.
| Failures in Interval | Cumulative Trials |
|---|---|
| 5 | 14 |
| 3 | 33 |
| 4 | 48 |
| 0 | 52 |
| 1 | 53 |
| 0 | 57 |
| 1 | 58 |
| 0 | 62 |
| 1 | 63 |
| 0 | 67 |
| 1 | 68 |
Using RGA 7, the parameters of the Crow-AMSAA model are estimated as follows:
- and:
- [math]\displaystyle{ \widehat{\lambda }=0.5588 }[/math]
As we have seen, the Crow-AMSAA instantaneous failure intensity, [math]\displaystyle{ {{\lambda }_{i}}(T) }[/math] , is defined as:
- [math]\displaystyle{ {{\lambda }_{i}}(T)=\lambda \beta {{T}^{\beta -1}},\text{with }T\gt 0,\text{ }\lambda \gt 0\text{ and }\beta \gt 0 }[/math]
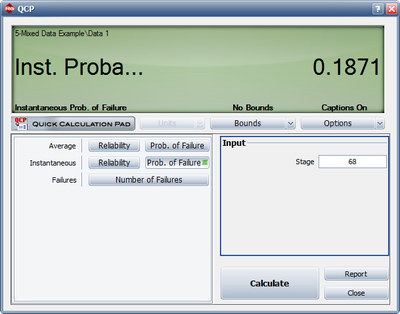
Using the above parameter estimates, we can calculate the or instantaneous unreliability at the end of the test, or [math]\displaystyle{ T=68. }[/math]
- [math]\displaystyle{ {{R}_{i}}(68)=0.5588\cdot 0.7950\cdot {{68}^{0.7950-1}}=0.1871 }[/math]
This result that can be obtained from the Quick Calculation Pad (QCP), for [math]\displaystyle{ T=68, }[/math] as seen in Figure Mixednst.FI.
The instantaneous reliability can then be calculated as:
- [math]\displaystyle{ {{R}_{inst}}=1-0.1871=0.8129 }[/math]
The average unreliability is calculated as:
- [math]\displaystyle{ \text{Average Unreliability }({{t}_{1,}}{{t}_{2}})=\frac{\lambda t_{2}^{\beta }-\lambda t_{1}^{\beta }}{{{t}_{2}}-{{t}_{1}}} }[/math]
and the average reliability is calculated as:
- [math]\displaystyle{ \text{Average Reliability }({{t}_{1,}}{{t}_{2}})=1-\frac{\lambda t_{2}^{\beta }-\lambda t_{1}^{\beta }}{{{t}_{2}}-{{t}_{1}}} }[/math]
Bounds on Average Failure Probability for Mixed Data
The process to calculate the average unreliability confidence bounds for mixed data is as follows:
- 1) Calculate the average failure probability .
- 2) There will exist a [math]\displaystyle{ {{t}^{*}} }[/math] between [math]\displaystyle{ {{t}_{1}} }[/math] and [math]\displaystyle{ {{t}_{2}} }[/math] such that the instantaneous unreliability at [math]\displaystyle{ {{t}^{*}} }[/math] equals the average unreliability . The confidence intervals for the instantaneous unreliability at [math]\displaystyle{ {{t}^{*}} }[/math] are the confidence intervals for the average unreliability .
Bounds on Average Reliability for Mixed Data
The process to calculate the average reliability confidence bounds for mixed data is as follows:
- 1) Calculate confidence bounds for average unreliability as described above.
- 2) The confidence bounds for reliability are 1 minus these confidence bounds for average unreliability.
