Grouped Data Reference Example: Difference between revisions
Jump to navigation
Jump to search
No edit summary |
Kate Racaza (talk | contribs) No edit summary |
||
| (24 intermediate revisions by 2 users not shown) | |||
| Line 1: | Line 1: | ||
{{Reference Example| | {{Reference Example|{{Banner RGA Reference_Examples}}|Grouped Data}} | ||
This example validates the results for grouped data in RGA. | |||
This example | |||
| Line 7: | Line 6: | ||
MIL-HDBK -189A, Section 6.3.1.7.5, pg. 162, 2009. | MIL-HDBK -189A, Section 6.3.1.7.5, pg. 162, 2009. | ||
For this example, the following will be calculated: | |||
*Parameters of the Crow-AMSAA (NHPP) model | |||
*Demonstrated MTBF (DMTBF) | |||
*Chi-squared goodness of fit | |||
{{Reference_Example_Heading2}} | {{Reference_Example_Heading2}} | ||
The following table shows the data. | |||
{| {{table}} | {| {{table}} | ||
! Failures in Interval||Interval End Time | |||
|- | |- | ||
| 13||20 | | 13||20 | ||
| Line 26: | Line 30: | ||
| 7||100 | | 7||100 | ||
|- | |- | ||
|+'''Termination Time = 100 hours''' | |||
|} | |} | ||
{{Reference_Example_Heading3}} | {{Reference_Example_Heading3}} | ||
Beta = 0.753, Lambda = 1.53 | The book has the following results: | ||
DMTBF = 2.6 | |||
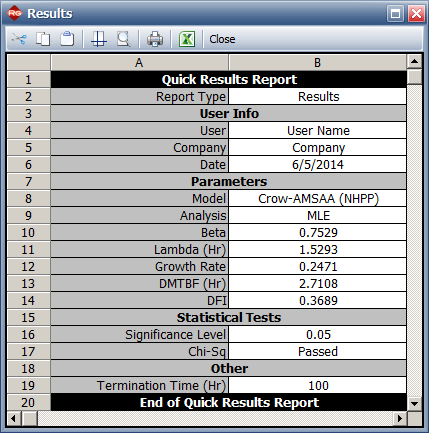
*Beta = 0.753, Lambda = 1.53 | |||
*DMTBF = 2.6 hours | |||
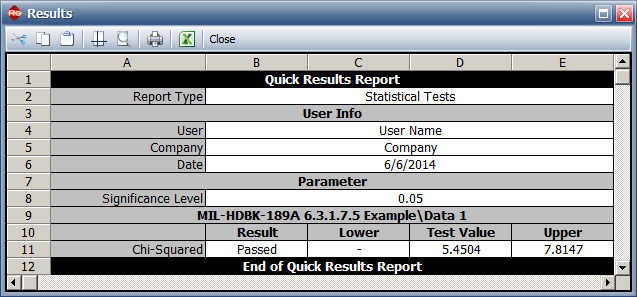
*<math>\,\!\chi ^{2}</math> = 5.5, critical value = 7.8 (Assume significance level = 0.1. Since <math>\,\!\chi ^{2}</math> < critical value can fail to reject hypothesis that the Crow-AMSAA model fits the data). | |||
{{Reference_Example_Heading4|RGA}} | |||
In RGA, the Crow-AMSAA (NHPP) model with the maximum likelihood estimation (MLE) method was used to calculate the results. | |||
*The model parameters are: | |||
[[image:MIL-HDBK-189A 6.3.1.7.5 Example_Results.png|center]] | |||
*The chi-squared goodness-of-fit test results: | |||
[[image:MIL-HDBK-189A 6.3.1.7.5 Example_Stats.png|center]] | |||
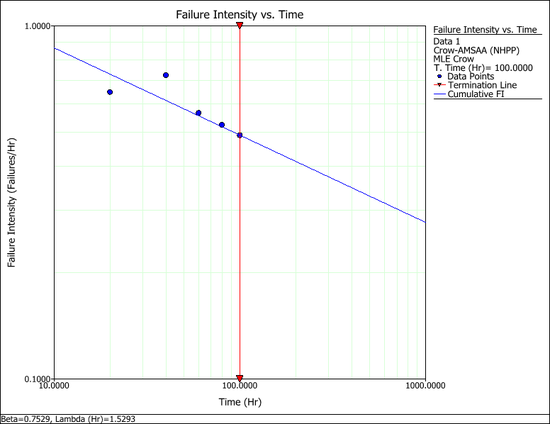
*Failure intensity vs. time plot: | |||
[[image:MIL-HDBK-189A 6.3.1.7.5 Example_Plot.png|center|550px]] | |||
Latest revision as of 18:26, 28 September 2015
New format available! This reference is now available in a new format that offers faster page load, improved display for calculations and images and more targeted search.
As of January 2024, this Reliawiki page will not continue to be updated. Please update all links and bookmarks to the latest references at RGA examples and RGA reference examples.


