Multi-Phase Example: Difference between revisions
No edit summary |
Lisa Hacker (talk | contribs) No edit summary |
||
| Line 1: | Line 1: | ||
<noinclude>{{Banner RGA Examples}} | <noinclude>{{Banner RGA Examples}} | ||
''This example appears in the [ | ''This example appears in the [https://help.reliasoft.com/reference/reliability_growth_and_repairable_system_analysis Reliability growth reference]''. | ||
</noinclude> | </noinclude> | ||
Latest revision as of 21:20, 18 September 2023
 |
New format available! This reference is now available in a new format that offers faster page load, improved display for calculations and images and more targeted search.
As of January 2024, this Reliawiki page will not continue to be updated. Please update all links and bookmarks to the latest references at RGA examples and RGA reference examples.
This example appears in the Reliability growth reference.
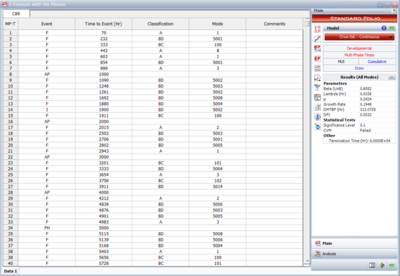
The Crow Extended - Continuous Evaluation model allows data analysis across multiple phases, up to seven individual phases. The next figure shows a portion of failure time test results obtained across six phases. Analysis points are specified for continuous evaluation every 1,000 hours. The cumulative test times at the end of each test phase are 5,000; 15,000; 25,000; 35,000; 45,000 and 60,000 hours.
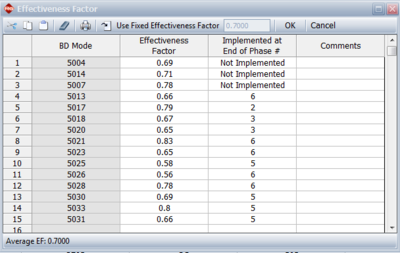
The next figure shows the effectiveness factors for the BD modes that do not have an associated fix implementation event. In other words, these are unfixed BD modes. Note that this specifies the phase after which the BD mode will be fixed, if any.
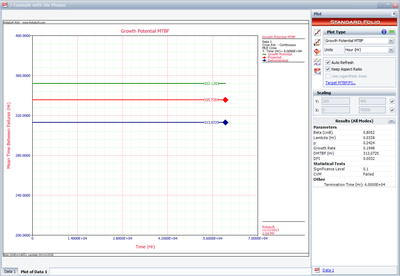
The next plot shows the overall test results in terms of demonstrated, projected and growth potential MTBF.
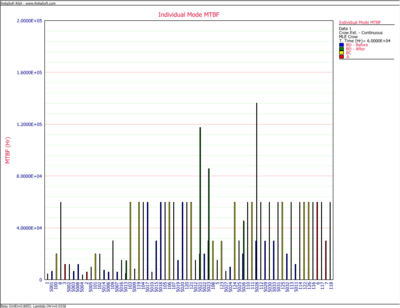
The next chart shows the "before" and "after" MTBFs for all the individual modes. Note that the "after" MTBFs are calculated by taking into account the respective effectiveness factors for each of the unfixed BD modes.
The analysis points are used to track overall growth inside and across phases, at desired intervals. The RGA software allows you to create a multi-phase plot that is associated with a multi-phase data sheet. In addition, if you have an existing growth planning folio in your RGA project, the multi-phase plot can plot the results from the multi-phase data sheet together with the reliability growth model from the growth planning folio. This allows you to track the overall reliability program against the goals, and set plans at each stage of the test. Additional information on combining a growth planning folio and a multi-phase plot is presented in the Reliability Growth Planning chapter.
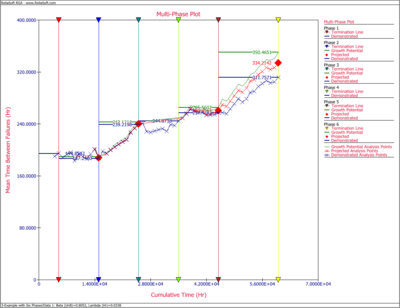
The next figure shows the multi-phase plot for the six phases of the reliability growth test program. This plot can be a powerful tool for overall tracking of the reliability growth program. It displays the termination time for each phase of testing, along with the demonstrated, projected and growth potential MTBFs at those times. The plot also displays the calculated MTBFs at specified analysis points, which are determined based on the "AP" events in the data sheet.
