Life Comparison Wizard: Difference between revisions
Kate Racaza (talk | contribs) No edit summary |
Lisa Hacker (talk | contribs) No edit summary |
||
| (2 intermediate revisions by 2 users not shown) | |||
| Line 1: | Line 1: | ||
<noinclude>{{Banner Weibull Examples}} | <noinclude>{{Banner Weibull Examples}} | ||
''This example appears in the [ | ''This example appears in the [https://help.reliasoft.com/reference/life_data_analysis Life data analysis reference].'' | ||
</noinclude> | </noinclude> | ||
| Line 18: | Line 18: | ||
\text{38} & \text{40} & \text{45} & \text{55} & \text{56} & \text{57} \\ | \text{38} & \text{40} & \text{45} & \text{55} & \text{56} & \text{57} \\ | ||
\text{67} & \text{76} & \text{90} & \text{115} & \text{126} & \text{197} \\ | \text{67} & \text{76} & \text{90} & \text{115} & \text{126} & \text{197} \\ | ||
\end{array}}}\,</math> </center> | \end{array}}}\,\,\!</math> </center> | ||
| Line 24: | Line 24: | ||
\text{15} & \text{32} & \text{61} & \text{67} & \text{75} \\ | \text{15} & \text{32} & \text{61} & \text{67} & \text{75} \\ | ||
\text{116} & \text{148} & \text{178} & \text{181} & \text{183} \\ | \text{116} & \text{148} & \text{178} & \text{181} & \text{183} \\ | ||
\end{array}}}\,</math> </center> | \end{array}}}\,\,\!</math> </center> | ||
</noinclude> | </noinclude> | ||
| Line 30: | Line 30: | ||
[[Image:Life Comparison Example 2 pdf Plot and Result.png|center| | [[Image:Life Comparison Example 2 pdf Plot and Result.png|center|600px| ]] | ||
Latest revision as of 21:38, 18 September 2023
New format available! This reference is now available in a new format that offers faster page load, improved display for calculations and images and more targeted search.
As of January 2024, this Reliawiki page will not continue to be updated. Please update all links and bookmarks to the latest references at Weibull examples and Weibull reference examples.
This example appears in the Life data analysis reference.
Using the Life Comparison Tool to Compare Two Designs
Using the following data sets, use Weibull++'s Life Comparison tool to estimate the probability that the units from the new design will outlast the units from the old design.
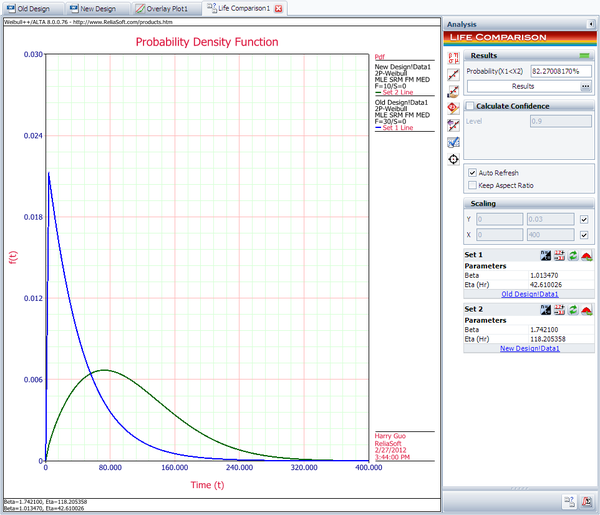
First, enter the data sets into two separate Weibull++ standard folios (or two separate data sheets within the same folio) and analyze the data sets using the two-parameter Weibull distribution and maximum likelihood estimation (MLE) method. Next, open the Life Comparison tool and select to compare the two data sets. The next figure shows the pdf curves and the result of the comparison.
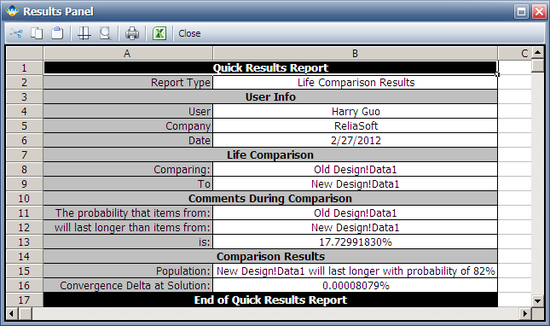
The comparison summary is given in the Results Panel window.


