Electronic Devices Example: Difference between revisions
Kate Racaza (talk | contribs) m (moved Template:Electronic Devices Example to Electronic Devices Example: incorrect namespace) |
Lisa Hacker (talk | contribs) No edit summary |
||
| (One intermediate revision by one other user not shown) | |||
| Line 1: | Line 1: | ||
<noinclude>{{Banner ALTA Examples}}</noinclude> | |||
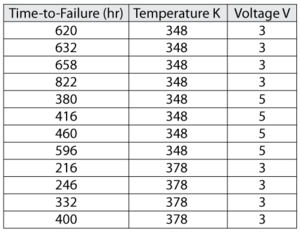
12 electronic devices are put into an accelerated life test. The accelerated stresses are temperature and voltage, with use level conditions of 328K and 2V, respectively. The following table shows the data from the test: | |||
[[Image:11_2ex.png|center|300px|]] | [[Image:11_2ex.png|center|300px|]] | ||
Do the following: | Do the following: | ||
1) Using the T-NT Weibull model, analyze the data | 1) Using the T-NT Weibull model, analyze the data and determine the MTTF and B(10) life for these devices at use level. Determine the upper and lower 90% 2-sided confidence intervals on the results. | ||
2) Examine the effects of each stress on life. | 2) Examine the effects of each stress on life. | ||
1. | |||
'''Solution''' | |||
1. Analyze the data set in the ALTA standard folio and use the Quick Calculation Pad (QCP) to compute for the MTTF and <math>B(10)</math> life. The results are shown next. | |||
[[Image:pv_ex2_1.gif|center|500px|]] | [[Image:pv_ex2_1.gif|center|500px|]] | ||
| Line 21: | Line 25: | ||
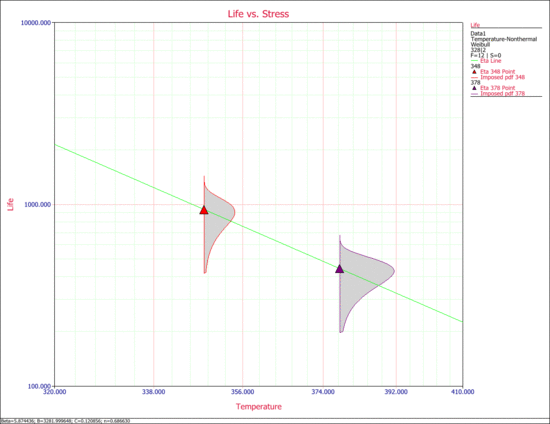
Specifically, the | 2. The next two figures examine the effects of each stress on life. Specifically, the first figure shows the Life vs. Voltage plot with the temperature held constant at 328K. The second figure shows the Life vs. Temperature plot with voltage held constant at 2V. | ||
[[Image:ALTA14.6.gif|center|550px|The effects of voltage on life, with temperature held constant at 328K.]] | |||
[[Image:ALTA14. | [[Image:ALTA14.7.gif|center|550px|The effects of temperature on life, with voltage held constant at 2V.]] | ||
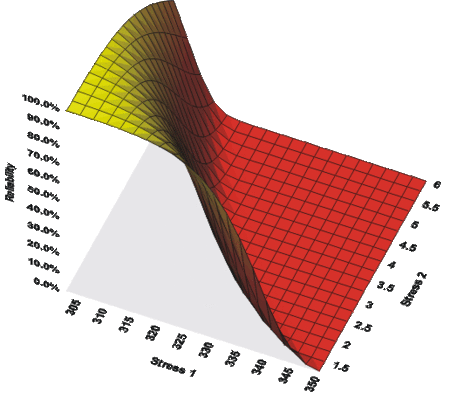
The next figure shows a 3D plot of reliability (at a constant time) versus both stresses. As you can see, the reliability declines slightly faster with the change in temperature than with the change in voltage. Note that in the following plot, Stress 1 refers to temperature and Stress 2 refers to voltage. | |||
[[Image:ALTA14.8.gif | [[Image:ALTA14.8.gif|center|450px|The combined effects of voltage and temperature on the reliability, as plotted in ALTA.]] | ||
Latest revision as of 02:48, 16 August 2012
New format available! This reference is now available in a new format that offers faster page load, improved display for calculations and images and more targeted search.
As of January 2024, this Reliawiki page will not continue to be updated. Please update all links and bookmarks to the latest references at ALTA examples and ALTA reference examples.
12 electronic devices are put into an accelerated life test. The accelerated stresses are temperature and voltage, with use level conditions of 328K and 2V, respectively. The following table shows the data from the test:
Do the following:
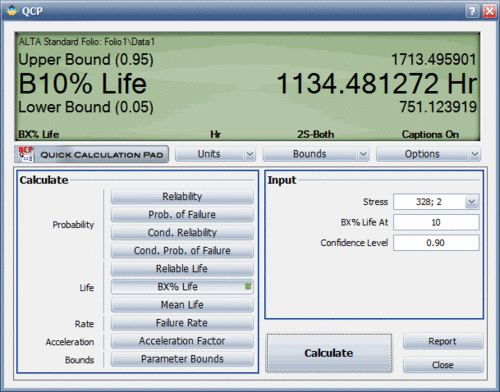
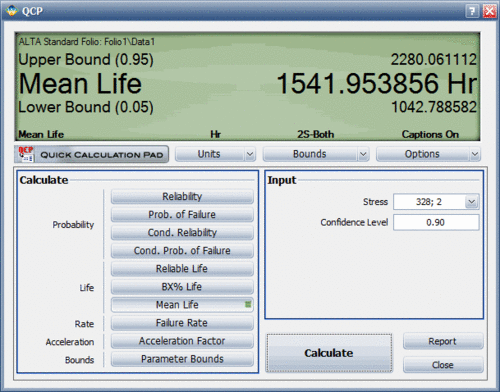
1) Using the T-NT Weibull model, analyze the data and determine the MTTF and B(10) life for these devices at use level. Determine the upper and lower 90% 2-sided confidence intervals on the results.
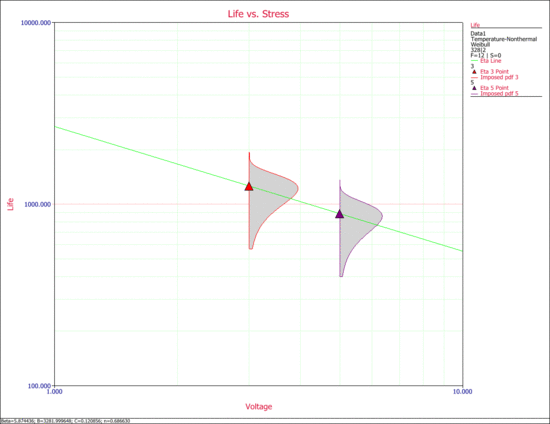
2) Examine the effects of each stress on life.
Solution
1. Analyze the data set in the ALTA standard folio and use the Quick Calculation Pad (QCP) to compute for the MTTF and [math]\displaystyle{ B(10) }[/math] life. The results are shown next.
2. The next two figures examine the effects of each stress on life. Specifically, the first figure shows the Life vs. Voltage plot with the temperature held constant at 328K. The second figure shows the Life vs. Temperature plot with voltage held constant at 2V.
The next figure shows a 3D plot of reliability (at a constant time) versus both stresses. As you can see, the reliability declines slightly faster with the change in temperature than with the change in voltage. Note that in the following plot, Stress 1 refers to temperature and Stress 2 refers to voltage.

