Weibull Distribution RRX Example: Difference between revisions
Chris Kahn (talk | contribs) No edit summary |
Lisa Hacker (talk | contribs) No edit summary |
||
| (12 intermediate revisions by 4 users not shown) | |||
| Line 1: | Line 1: | ||
<noinclude>{{Banner Weibull Examples}} | <noinclude>{{Banner Weibull Examples}} | ||
''This examples also appears in the [ | ''This examples also appears in the [https://help.reliasoft.com/reference/life_data_analysis Life data analysis reference].'' | ||
</noinclude> | </noinclude> | ||
Assume that | Assume that 6 identical units are being tested. The failure times are: 93, 34, 16, 120, 53 and 75 hours. | ||
1. What is the unreliability of the units for a mission duration of 30 hours, starting the mission at age zero? | |||
2. What is the reliability for a mission duration of 10 hours, starting the new mission at the age of T = 30 hours? | |||
3. What is the longest mission that this product should undertake for a reliability of 90%? | |||
'''Solution''' | '''Solution''' | ||
First, use Weibull++ to obtain the parameters using RRX. | 1. First, we use Weibull++ to obtain the parameters using RRX. | ||
Then, we investigate several methods of solution for this problem. The first, and more laborious, method is to extract the information directly from the plot. You may do this with either the screen plot in RS Draw or the printed copy of the plot. (When extracting information from the screen plot in '''RS Draw''', note that the translated axis position of your mouse is always shown on the bottom right corner.) | Then, we investigate several methods of solution for this problem. The first, and more laborious, method is to extract the information directly from the plot. You may do this with either the screen plot in RS Draw or the printed copy of the plot. (When extracting information from the screen plot in '''RS Draw''', note that the translated axis position of your mouse is always shown on the bottom right corner.) | ||
[[Image: RS Draw.png|center| | [[Image: RS Draw.png|center|650px]] | ||
Using this first method, enter either the screen plot or the printed plot with T = 30 hours, go up vertically to the straight line fitted to the data, then go horizontally to the ordinate, and read off . | Using this first method, enter either the screen plot or the printed plot with T = 30 hours, go up vertically to the straight line fitted to the data, then go horizontally to the ordinate, and read off the result. A good estimate of the unreliability is 23%. (Also, the reliability estimate is 1.0 - 0.23 = 0.77 or 77%.) | ||
The second method involves the use of the Quick Calculation Pad (QCP). | The second method involves the use of the Quick Calculation Pad (QCP). | ||
Select '''Prob. of Failure''' calculation option and enter 30 hours in the Mission End Time | Select the '''Prob. of Failure''' calculation option and enter 30 hours in the '''Mission End Time''' field. | ||
[[Image: QCP Result.png|center| | [[Image: QCP Result.png|center|650px]] | ||
Note that the results in QCP vary according to the parameter estimation method used. The above results are obtained using RRX. | Note that the results in QCP vary according to the parameter estimation method used. The above results are obtained using RRX. | ||
2. The conditional reliability is given by: | |||
::<math>R(t|T)=\frac{R(T+t)}{R(T)}\,\!</math> | |||
or: | |||
::<math>\hat{R}(10hr|30hr)=\frac{\hat{R}(10+30)}{\hat{R}(30)}=\frac{\hat{R}(40)}{\hat{R}(30)}\,\!</math> | |||
Again, the QCP can provide this result directly and more accurately than the plot. | |||
[[Image: Conditional R.png|center|650px]] | |||
3. To use the QCP to solve for the longest mission that this product should undertake for a reliability of 90%, choose '''Reliable Life''' and enter '''0.9''' for the required reliability. The result is 15.9933 hours. | |||
[[Image: Reliable Life.png|center|650px]] | |||
Latest revision as of 21:46, 18 September 2023
New format available! This reference is now available in a new format that offers faster page load, improved display for calculations and images and more targeted search.
As of January 2024, this Reliawiki page will not continue to be updated. Please update all links and bookmarks to the latest references at Weibull examples and Weibull reference examples.
This examples also appears in the Life data analysis reference.
Assume that 6 identical units are being tested. The failure times are: 93, 34, 16, 120, 53 and 75 hours.
1. What is the unreliability of the units for a mission duration of 30 hours, starting the mission at age zero?
2. What is the reliability for a mission duration of 10 hours, starting the new mission at the age of T = 30 hours?
3. What is the longest mission that this product should undertake for a reliability of 90%?
Solution
1. First, we use Weibull++ to obtain the parameters using RRX.
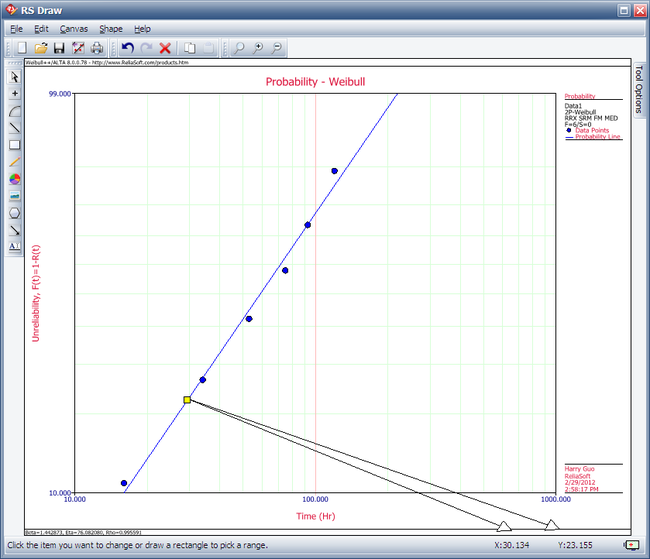
Then, we investigate several methods of solution for this problem. The first, and more laborious, method is to extract the information directly from the plot. You may do this with either the screen plot in RS Draw or the printed copy of the plot. (When extracting information from the screen plot in RS Draw, note that the translated axis position of your mouse is always shown on the bottom right corner.)
Using this first method, enter either the screen plot or the printed plot with T = 30 hours, go up vertically to the straight line fitted to the data, then go horizontally to the ordinate, and read off the result. A good estimate of the unreliability is 23%. (Also, the reliability estimate is 1.0 - 0.23 = 0.77 or 77%.)
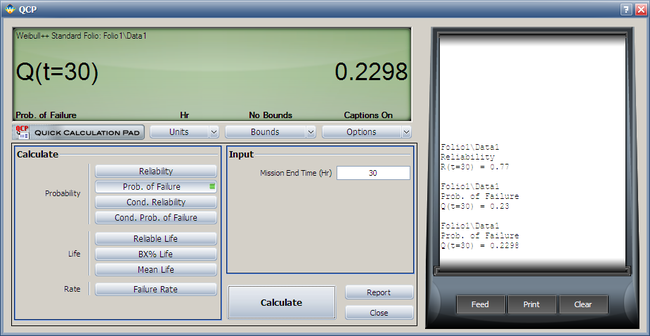
The second method involves the use of the Quick Calculation Pad (QCP).
Select the Prob. of Failure calculation option and enter 30 hours in the Mission End Time field.
Note that the results in QCP vary according to the parameter estimation method used. The above results are obtained using RRX.
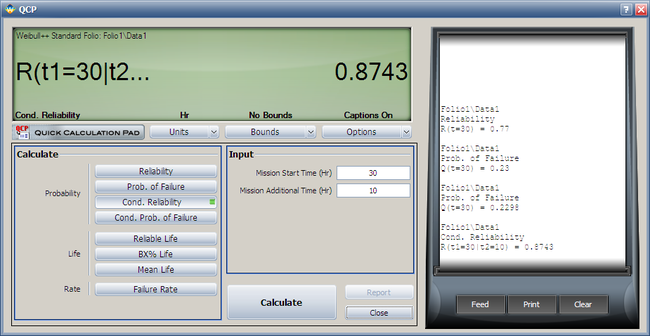
2. The conditional reliability is given by:
- [math]\displaystyle{ R(t|T)=\frac{R(T+t)}{R(T)}\,\! }[/math]
or:
- [math]\displaystyle{ \hat{R}(10hr|30hr)=\frac{\hat{R}(10+30)}{\hat{R}(30)}=\frac{\hat{R}(40)}{\hat{R}(30)}\,\! }[/math]
Again, the QCP can provide this result directly and more accurately than the plot.
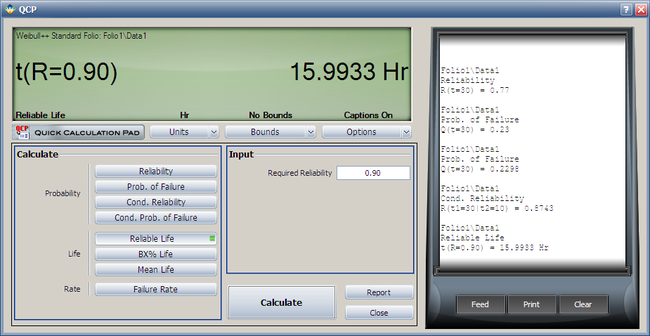
3. To use the QCP to solve for the longest mission that this product should undertake for a reliability of 90%, choose Reliable Life and enter 0.9 for the required reliability. The result is 15.9933 hours.


