3-Parameter Weibull Example: Difference between revisions
Chris Kahn (talk | contribs) No edit summary |
Lisa Hacker (talk | contribs) No edit summary |
||
| (2 intermediate revisions by one other user not shown) | |||
| Line 1: | Line 1: | ||
{ | {{Banner Weibull Examples}} | ||
6 identical units are reliability tested under the same stresses and conditions. All units are tested to failure and the following times-to-failure are recorded: 48, 66, 85, 107, 125 and 152 hours. Find the parameters of the 3-parameter Weibull distribution using probability plotting. | |||
Latest revision as of 00:50, 16 August 2012
 |
New format available! This reference is now available in a new format that offers faster page load, improved display for calculations and images and more targeted search.
As of January 2024, this Reliawiki page will not continue to be updated. Please update all links and bookmarks to the latest references at Weibull examples and Weibull reference examples.
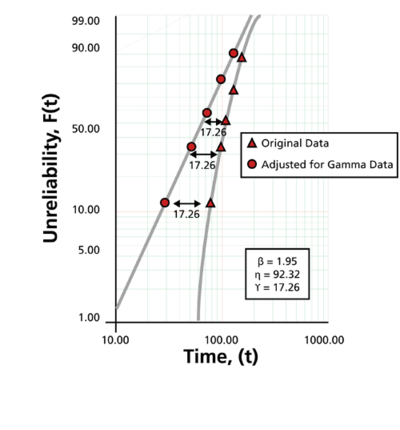
6 identical units are reliability tested under the same stresses and conditions. All units are tested to failure and the following times-to-failure are recorded: 48, 66, 85, 107, 125 and 152 hours. Find the parameters of the 3-parameter Weibull distribution using probability plotting.
Solution
The following figure shows the results. Note that since the original data set was concave down, 17.26 was subtracted from all the times-to-failure and replotted, resulting in a straight line, thus γ = 17.26. (We used Weibull++ to get the results. To perform this by hand, one would attempt different values of γ, using a trial and error methodology, until an acceptable straight line is found. When performed manually, you do not expect decimal accuracy.)
