Using FMRA to Estimate Baseline Reliability: Difference between revisions
Lisa Hacker (talk | contribs) |
Lisa Hacker (talk | contribs) No edit summary |
||
| (8 intermediate revisions by 3 users not shown) | |||
| Line 1: | Line 1: | ||
{{Banner Xfmea Articles}}{{Navigation box}} | |||
==Introduction== | ==Introduction== | ||
As you may have seen when exploring the different standards and templates for FMEA, the analysis method can be modified to meet different objectives. Regardless of what the objective is, at the end of the day the FMEA process will produce a wealth of information from a cross-functional team that should be leveraged for subsequent Design for Reliability (DFR) activities. | As you may have seen when exploring the different standards and templates for FMEA, the analysis method can be modified to meet different objectives. Regardless of what the objective is, at the end of the day the FMEA process will produce a wealth of information from a cross-functional team that should be leveraged for subsequent Design for Reliability (DFR) activities. | ||
| Line 24: | Line 25: | ||
To illustrate the FMRA process, consider a simple example based on the assembly/component DFMEAs for a single light pendant chandelier. The following picture shows the rating scale that was used by the team when they assigned an occurrence rating to each failure cause identified in the FMEA. In addition to the qualitative ratings and criteria (e.g., 1 = 1 in 1 Million), the scale also has a quantitative value associated with each rating (e.g., 1 in 1 Million = 0.000001). | To illustrate the FMRA process, consider a simple example based on the assembly/component DFMEAs for a single light pendant chandelier. The following picture shows the rating scale that was used by the team when they assigned an occurrence rating to each failure cause identified in the FMEA. In addition to the qualitative ratings and criteria (e.g., 1 = 1 in 1 Million), the scale also has a quantitative value associated with each rating (e.g., 1 in 1 Million = 0.000001). | ||
<center>[[File: | <center>[[File:fmra_occurrence_scale_large.png]]</center> | ||
Based on this probability of occurrence and its corresponding probabilistic definition, one can easily build a one-parameter exponential reliability model for each failure cause as follows: | Based on this probability of occurrence and its corresponding probabilistic definition, one can easily build a one-parameter exponential reliability model for each failure cause as follows: | ||
<br> | |||
<center><math>\text{Probability }\!\!~\!\!\text{ of }\!\!~\!\!\text{ Failure }\!\!~\!\!\text{ at }\!\!~\!\!\text{ Time}~t=Q\left( t \right) | <center><math>\text{Probability }\!\!~\!\!\text{ of }\!\!~\!\!\text{ Failure }\!\!~\!\!\text{ at }\!\!~\!\!\text{ Time}~t=Q\left( t \right)</math> | ||
</center> | </center> | ||
Assuming an exponential distribution, its single parameter λ can be estimated as follows: | Assuming an exponential distribution, its single parameter λ can be estimated as follows: | ||
<br> | |||
<center><math>1-Q\left( T \right)=R\left( t \right)={{e}^{-\lambda t}}</math> | <center><math>1-Q\left( T \right)=R\left( t \right)={{e}^{-\lambda t}}</math> | ||
</center> | </center> | ||
<br> | <br> | ||
<center><math>\frac{-\text{ln}(1 | <center><math>\frac{-\text{ln}(1-Q(t))}{t}=\lambda </math></center> | ||
</center> | |||
Note that the exponential distribution is the default choice because a single probability value/time is the only information available. When better information is obtained, other more appropriate models should be utilized to describe the reliability. (See later discussion in the “FMRA Vetting Process” section.) | Note that the exponential distribution is the default choice because a single probability value/time is the only information available. When better information is obtained, other more appropriate models should be utilized to describe the reliability. (See later discussion in the “FMRA Vetting Process” section.) | ||
| Line 45: | Line 45: | ||
Note that more complex configurations may be appropriate to describe the reliability-wise relationships of the failure causes and/or components. These can be implemented in the analysis after the first draft is completed. (See later discussion in the “Next Steps” section.) | Note that more complex configurations may be appropriate to describe the reliability-wise relationships of the failure causes and/or components. These can be implemented in the analysis after the first draft is completed. (See later discussion in the “Next Steps” section.) | ||
<center>[[File: | <center>[[File:fmra_table_3.png]]</center> | ||
It is extremely important to note at this point that, even though we just computed a system reliability value, this first draft FMRA value may be nowhere close to the true reliability. What we need to do now is go back through the first draft and review each entry and result. We will call this subsequent step the “FMRA Vetting” process. | It is extremely important to note at this point that, even though we just computed a system reliability value, this first draft FMRA value may be nowhere close to the true reliability. What we need to do now is go back through the first draft and review each entry and result. We will call this subsequent step the “FMRA Vetting” process. | ||
Latest revision as of 05:20, 23 August 2012
Introduction
As you may have seen when exploring the different standards and templates for FMEA, the analysis method can be modified to meet different objectives. Regardless of what the objective is, at the end of the day the FMEA process will produce a wealth of information from a cross-functional team that should be leveraged for subsequent Design for Reliability (DFR) activities.
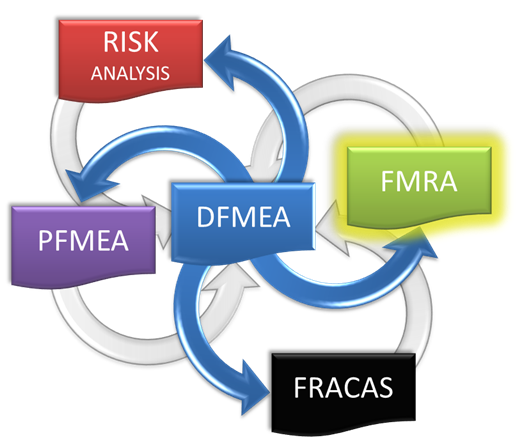
Most of us are familiar with the traditional approaches of using information from the design FMEA (DFMEA) as an input to design verification plans (DVP&Rs), process FMEAs and process control plans. Some practitioners also have experience with using FMEA data to generate fault trees for advanced risk analysis. What we have not done to date is use the DFMEA as the starting point in our reliability analysis, and as an integral part of our DFR process. Along these lines, then, we would like to introduce you to a new type of analysis based on the DFMEA called Failure Modes and Reliability Analysis (FMRA).
FMEA from a DFR and Reliability Perspective
On its own, the DFMEA activity accomplishes its objectives of identifying potential failures, assessing risk and initiating corrective actions to improve the design. In doing so, the analysis also produces a wealth of information that can be effectively leveraged by other activities. As an example, and early on in the design process, the DFMEA can be used to generate a baseline estimate of the design’s reliability, which is sought as part of the overall DFR program.
As a starting point when other reliability information is not yet available, the quantitative probability of occurrence for each failure cause can be obtained from the qualitative occurrence rating that has been assigned by the FMEA team as part of the traditional risk priority number (RPN) calculation. For the purposes of this analysis, the traditional FMEA occurrence scale can be expanded to include a quantitative value for each rating in the scale. For example, if the FMEA team assumed that the occurrence rating labeled “Rare” implies 1:100,000 then Probability of Occurrence = 0.0010%.
This can be treated as a fixed probability (Q) that is the same regardless of how long the product operates. Alternatively, and for better reliability modeling, a life distribution could be used to describe this probability. For example, if the FMEA team assumed that the probability of occurrence by 1,000 hours of operation is “Rare” (1:100,000), then an exponential distribution could be easily substituted by computing a lambda for a time=1,000 where the unreliability (i.e., probability of occurrence of this failure cause) is 0.0010%.
Then, for each item within the existing FMEA, a fault tree or reliability block diagram (RBD) can be easily constructed relating the probability of occurrence of each cause to the probability of failure of the item. For example, if the team assumes that the item will fail if any one of the failure causes occurs, this could be modeled with a series configuration RBD or an OR gate in a fault tree. The model can then be expanded to the entire system using combinations of RBDs and fault trees, rolling up from the FMEA causes to the system level.
Note that for series reliability-wise configurations, the Xfmea/RCM++ software can automatically construct the RBDs (in the background) based on the system configuration and failure causes defined in the FMEAs. For more complex configurations, the software allows users to view and modify the configurations in a synchronized view of the FMRA in BlockSim.
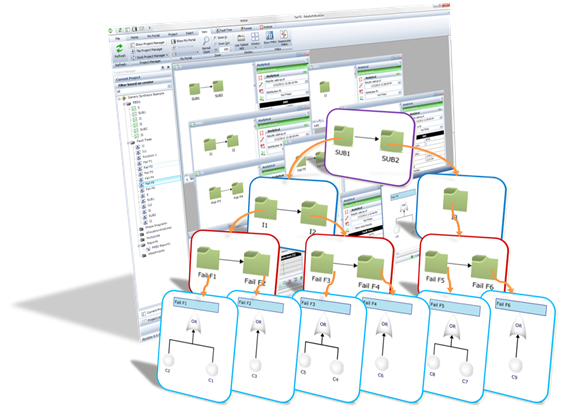
With this approach, the reliability modeling subject matter expert leverages the work done by the FMEA team to automatically create a baseline reliability model. Obviously, and at this stage, the results obtained at the system level are solely based on the probabilities of occurrence defined for each cause in the FMEA, which may or may not be correct. During this modeling activity, an overall assessment of the validity of these values can be performed and communicated back to the FMEA team for reassessment, modification or further information gathering actions (e.g., reliability testing). (See later discussion in the “FMRA Vetting Process” section.)
Illustrating the FMRA Process
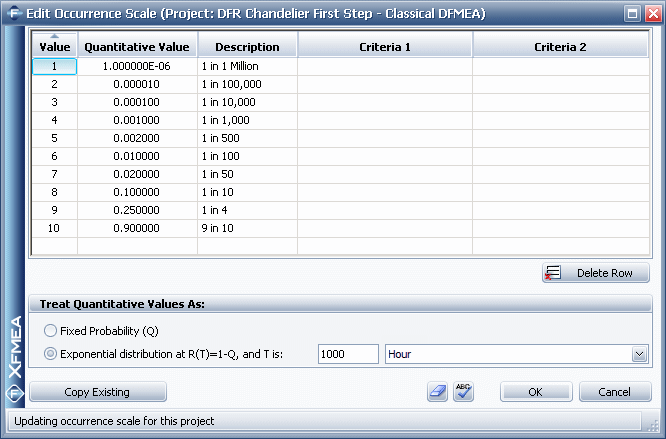
To illustrate the FMRA process, consider a simple example based on the assembly/component DFMEAs for a single light pendant chandelier. The following picture shows the rating scale that was used by the team when they assigned an occurrence rating to each failure cause identified in the FMEA. In addition to the qualitative ratings and criteria (e.g., 1 = 1 in 1 Million), the scale also has a quantitative value associated with each rating (e.g., 1 in 1 Million = 0.000001).
Based on this probability of occurrence and its corresponding probabilistic definition, one can easily build a one-parameter exponential reliability model for each failure cause as follows:
Assuming an exponential distribution, its single parameter λ can be estimated as follows:
Note that the exponential distribution is the default choice because a single probability value/time is the only information available. When better information is obtained, other more appropriate models should be utilized to describe the reliability. (See later discussion in the “FMRA Vetting Process” section.)
Now, assuming that any one of these causes could cause the component to fail (reliability-wise in series), an initial reliability estimate at any given time could easily be obtained by combining the causes to get the reliability of the component and then combining components and assemblies until we reach the system level. We will call this the “first draft” FMRA. Note that more complex configurations may be appropriate to describe the reliability-wise relationships of the failure causes and/or components. These can be implemented in the analysis after the first draft is completed. (See later discussion in the “Next Steps” section.)
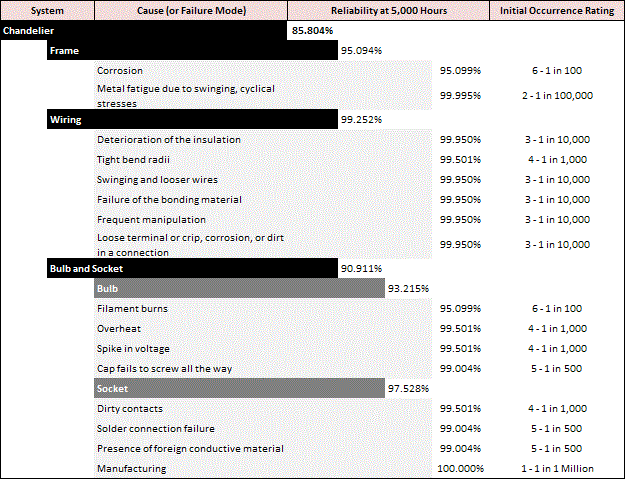
It is extremely important to note at this point that, even though we just computed a system reliability value, this first draft FMRA value may be nowhere close to the true reliability. What we need to do now is go back through the first draft and review each entry and result. We will call this subsequent step the “FMRA Vetting” process.
The FMRA Vetting Process
The first draft of the FMRA is just that, a draft. It needs to be thoroughly reviewed and vetted before proceeding. The list that follows outlines items that need to be considered in the vetting process.
When you are ready to begin modifying the first draft of the FMRA in the Xfmea/RCM++ software, one option is to create a copy of the project so the original DFMEA can remain unchanged and you can modify the FMRA in a separate project. The drawback of this approach is that you will now dissociate the FMRA from the DFMEA and changes made to either will not be reflected in both. As an alternative, the list below includes tips for ways that you can adjust the FMRA for the purposes of a more accurate reliability calculation while still maintaining synchronization with the original DFMEA.
Clean Up
1) Discount/eliminate issues that have no impact on reliability. Depending on how the FMEA was done, there may be multiple items, functions, failures or causes in the DFMEA that have no impact on reliability. For example:
- a) A failure in the DFMEA could be "Design fails to aesthetically please the customer" with multiple causes such as "Red color is disliked by X% of the population," etc. While these are important considerations during design, the color of the chandelier is irrelevant from a reliability perspective.
- b) Other failures could be process issues that will be addressed in manufacturing, or items that will not impact reliability if the appropriate controls are put in place.
In short, we need to remove failures that are not reliability-related from our FMRA. If you wish to maintain synchronization with the original DFMEA, instead of deleting records from the original FMEA, you can set their reliability to 100% (i.e., cannot fail). Doing so excludes the issues from the reliability analysis but keeps the FMRA and DFMEA synchronized in the same project and tightly integrated.
2) Include other contributing items not considered in the FMEA that have an impact on reliability. There may be other failures including interfaces that were not included in the DFMEA. These will need to be added into the FMRA.
3) Account for common causes that may appear multiple times in the FMEA. Depending on how the DFMEA was done, a single cause may appear more than once. From a reliability perspective, the item only fails once, and a single failure should not be counted multiple times. If you wish to maintain synchronization with the original DFMEA, you can use the mirroring functionality to ensure that common cause failure modes are handled appropriately in the analysis.
Review and Validate Inputs
4) Review each occurrence rating assigned during the DFMEA and its derived reliability equivalent. The resulting values are only as good as the inputs provided (“garbage in, garbage out”). In this case, the inputs are the qualitative occurrence ratings from the FMEA team. The team could be wrong on some or all of them.
- a) Compare/cross-reference the occurrence rating value with other FMEAs done by other teams on similar items and similar environments. In Xfmea/RCM++, it is easy to search through all FMEAs stored in the same Synthesis repository.
- b) Review any available historical data, published data and warranty data, as well as all related analysis and models that have been performed to describe the reliability of the item at the expected use conditions.
- Look for similar models in the Synthesis repository (i.e., Weibull++, ALTA or other analyses on similar items).
- Look for reference data in published standards (e.g., standards based reliability prediction).
- Cross-reference with data from the failure reporting, analysis and corrective action system (FRACAS).
- c) Get expert opinion and use the Quick Parameter Estimator within Xfmea/RCM++ to translate these opinions into usable models.
- d) Use physics of failure, computer simulation, finite element analysis and other tools and methods.
- e) In cases where no reasonable assessment can be made, testing may need to be performed. Make this testing a part of the reliability plan and set aside a budget for it.
- f) Do a common-sense reality check on the values given! As an example, in the chandelier FMRA example shown above, the reliability of the bulb was calculated as 93% after 5,000 hours of operation. If this is an incandescent bulb, this value may be overly optimistic.
5) Question the dangerous exponential assumption. Even though we used an exponential model for the initial transition to a reliability model, remember that this distribution assumes a constant failure rate. For the majority of items, this assumption is invalid. If wearout is present or suspected, you may need to replace these initial models with distributions that have non-constant failure rates (e.g., Weibull or lognormal). In the absence of data, you can use the Quick Parameter Estimator within Xfmea/RCM++ to translate these into different models. For example, if beta is known for a specific failure mode, use a 1-parameter Weibull distribution coupled with the stated probability.
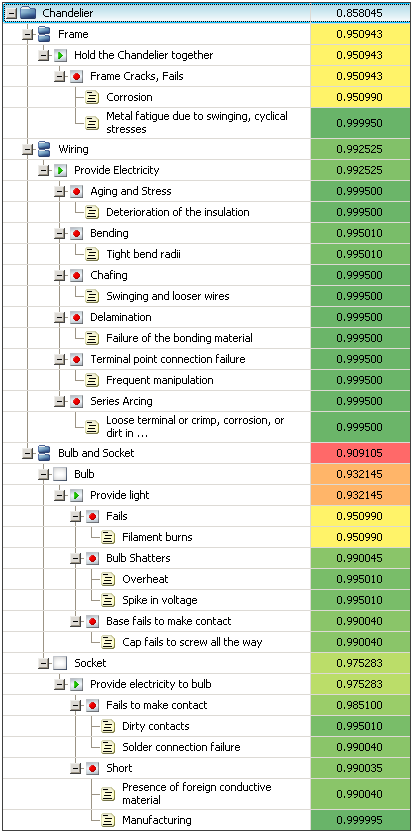
6) Comparatively review and rank all values to further identify inconsistencies. Re-compute the FMRA based on the modifications performed so far. Use the color-coding feature to look at causes/failure modes that are high unreliability contributors. Assess if this is valid. For each item in question, repeat the above steps.
7) Review all items in question with the original FMEA team, revise the DFMEA as appropriate and regenerate the FMRA. At this point, the DFMEA will likely be modified to take the new information into account, and then the FMRA can be regenerated. Depending on the number of changes and the extent of your participation, you may have to go through the vetting process again.
Next Steps
Once vetted, the baseline reliability value is now your initial design reliability. Compare this with the target reliability, keeping in mind that this first baseline estimate is usually optimistic. Furthermore, the product needs to go through manufacturing, and the manufacturing process isn’t going to increase the reliability, thus you want your initial baseline reliability value to exceed your reliability target value.
If the initial baseline is not sufficient for the target, you may expand the analysis to include RBDs in BlockSim and continue with different types of analysis including reliability importance and reliability allocation. Reliability importance analysis provides more advanced methods to identify the issues that have the biggest contribution on the overall reliability. Reliability allocation analysis provides reliability requirements for each item (all the way down to the cause level) so that the target is met. For causes that have higher reliability requirements (which translate back to lower probability of occurrence), a review of the new requirements with the FMEA team is advised so that additional corrective actions can be assigned if necessary to assure that the new requirements are met. This may again require a revision of the FMEA and the FMRA.
From a knowledge base perspective, the FMEA and related FMRA should continuously be updated as new information becomes available, including the addition of new failure modes uncovered during testing and the revision of the underlying reliability models based on data obtained from testing. After the product’s release, this process should continue with field information.

