Simple Throughput Analysis Example: Difference between revisions
Lisa Hacker (talk | contribs) No edit summary |
Lisa Hacker (talk | contribs) No edit summary |
||
| (12 intermediate revisions by 2 users not shown) | |||
| Line 1: | Line 1: | ||
<noinclude>{{Banner BlockSim Examples}}</noinclude> | <noinclude>{{Banner BlockSim Examples}} | ||
Consider the simple system shown in figure below, but with | ''This example also appears in the [https://help.reliasoft.com/reference/system_analysis System analysis reference]''. </noinclude> | ||
Consider the simple system shown in the figure below, but with <math>E\,\!</math> operating. | |||
[[Image:system diagram.png|center|350px|The system diagram ]] | |||
[[Image:system diagram.png|center|350px|The system diagram|link=]] | |||
In addition, consider the following deterministic failure and repair characteristics: | In addition, consider the following deterministic failure and repair characteristics: | ||
[[Image:throughput_characteristics.png|center|450px|]] | [[Image:throughput_characteristics.png|center|450px|link=]] | ||
Also: | Also: | ||
*Set all units to operate through system failure. | |||
*Do not add spare part pools or crews (use defaults). | |||
*Do not send items to failed units. | |||
*Use a weighted allocation scheme. | |||
===Event History: 0 to 100 Time Units=== | |||
Then the system behavior from 0 to 100 time units is given in the table below. The system event history is as follows: | Then the system behavior from 0 to 100 time units is given in the table below. The system event history is as follows: | ||
[[Image:event history.png|center|250px||link=]] | |||
[[Image:event history.png|center| | |||
Once the system history has been established, we can examine the throughput behavior of this system from 0 to 100 by observing the sequence of events and their subsequent effect on system throughput. | Once the system history has been established, we can examine the throughput behavior of this system from 0 to 100 by observing the sequence of events and their subsequent effect on system throughput. | ||
[[Image:system behavior.png|center|link=]] | |||
[[Image:system behavior.png|center]] | |||
'''Event 1: B Fails at 50''' | '''Event 1: B Fails at 50''' | ||
:• At 50, B fails. | :• At 50, B fails. | ||
:• From 0 to 50, A processes | :• From 0 to 50, A processes <math>50\cdot 60=3000\,\!</math> items. | ||
:• 500 are sent to B , 1000 to | :• 500 are sent to B , 1000 to <math>C\,\!</math> and 1500 to <math>D\,\!</math>. There is no excess capacity at B , <math>C\,\!</math> or <math>D\,\!</math>. | ||
:• B , | :• B , <math>C\,\!</math> and <math>D\,\!</math> process and send 3000 items to <math>E\,\!</math>. Because the capacity of <math>E\,\!</math> is 3500, <math>E\,\!</math> now has an excess capacity of 500. | ||
:• The next table summarizes these results: | :• The next table summarizes these results: | ||
[[Image:event 1.png|center| | [[Image:event 1.png|center|550px|link=]] | ||
'''Event 2: B is Down 50 to 54''' | '''Event 2: B is Down 50 to 54''' | ||
:• From 50 to 54, B is down. | :• From 50 to 54, B is down. | ||
:• A processes 240 items and sends 96 to | :• A processes 240 items and sends 96 to <math>C\,\!</math> and 144 to <math>D\,\!</math>. | ||
:• <math>D</math> | :• <math>D\,\!</math> and <math>C\,\!</math> can only process 80 and 120 respectively during this time. Thus, they get backlogs of 16 and 24 respectively. | ||
:• The 200 processed are sent to | :• The 200 processed are sent to <math>E\,\!</math>. <math>E\,\!</math> has an excess capacity of 80 during this time period. | ||
:• The next table summarizes these results: | :• The next table summarizes these results: | ||
'''Event 3: All Up 54 to 55''' | [[Image:table 2.png|center|550px|link=]] | ||
'''Event 3: All Up 54 to 55''' | |||
The next table summarizes the results: | The next table summarizes the results: | ||
'''Event 4: | [[Image:event 3.png|center|550px|link=]] | ||
'''Event 4: <math>C\,\!</math> is Down 55 to 59''' | |||
The next table summarizes the results: | The next table summarizes the results: | ||
'''Event 5: All Up 59 to 60''' | [[Image:event 4.png|center|550px|link=]] | ||
'''Event 5: All Up 59 to 60''' | |||
The next table summarizes the results: | The next table summarizes the results: | ||
'''Event 6: | [[Image:event 5.png|center|550px|link=]] | ||
'''Event 6: <math>D\,\!</math> is Down 60 to 64'''<br> | |||
The next table summarizes the results: | The next table summarizes the results: | ||
'''Event 7: All Up 64 to 65''' | [[Image:event 6.png|center|550px|link=]] | ||
'''Event 7: All Up 64 to 65''' | |||
The next table summarizes the results: | The next table summarizes the results: | ||
'''Event 8: A is Down 65 to 69''' | [[Image:event 7.png|center|550px|link=]] | ||
'''Event 8: A is Down 65 to 69''' | |||
Between 65 and 69, A fails. This stops the flow of items in the system and provides an opportunity for the other blocks to process their backlogs. As an example, B processes 40 items from the 60 items in its backlog. Specifically: | Between 65 and 69, A fails. This stops the flow of items in the system and provides an opportunity for the other blocks to process their backlogs. As an example, B processes 40 items from the 60 items in its backlog. Specifically: | ||
'''Event 9: All Up 69 to 70''' | [[Image:event 8.png|center|550px|link=]] | ||
'''Event 9: All Up 69 to 70''' | |||
The next table summarizes the results: | The next table summarizes the results: | ||
'''Event 10: | [[Image:event 9.png|center|550px|link=]] | ||
From 70 to 74, | |||
'''Event 10: <math>E\,\!</math> is Down 60 to 64''' | |||
[[Image:event 10.png|center| | |||
< | From 70 to 74, <math>E\,\!</math> is down. Because we specified that we will not send items to failed units, B , <math>C\,\!</math> and <math>D\,\!</math> receive items from A but they do not process them, since processing would require that items be sent to <math>E\,\!</math>. The items received by B , <math>C\,\!</math> and <math>D\,\!</math> are added to their respective backlogs. Furthermore, since they could have processed them if <math>E\,\!</math> had been up, all three blocks have an excess capacity for this period. Specifically: | ||
[[Image:event 10.png|center|550px|link=]] | |||
It should be noted that if we had allowed items to be sent to failed blocks, B , <math>C\,\!</math> and <math>D\,\!</math> would have processed the items received and the backlog would have been at <math>E\,\!</math>. The rest of the time, all units are up. | |||
'''Event 11: All Up 74 to 100''' | |||
The next table summarizes the results: | The next table summarizes the results: | ||
[[Image:event 11.png|center| | [[Image:event 11.png|center|550px|link=]] | ||
===Exploring the Results=== | ===Exploring the Results=== | ||
BlockSim provides all of these results via the Simulation Results Explorer. The figure below shows the system throughput summary. | BlockSim provides all of these results via the Simulation Results Explorer. The figure below shows the system throughput summary. | ||
[[Image:9.10.gif|center| | [[Image:9.10.gif|center|600px|link=]] | ||
System level results present the total system throughput, which is 5484 items in this example. Additionally, the results include the uptime utilization of each component. | System level results present the total system throughput, which is 5484 items in this example. Additionally, the results include the uptime utilization of each component. | ||
The block level result summary, shown next, provides additional results for each item. | The block level result summary, shown next, provides additional results for each item. | ||
[[Image:9.11.gif|center| | [[Image:9.11.gif|center|700px|link=]] | ||
Finally, specific throughput results and metrics for each block are provided, as shown next. | Finally, specific throughput results and metrics for each block are provided, as shown next. | ||
[[Image:9.12.gif|center|600px|link=]] | |||
[[Image:9.12.gif|center| | |||
Latest revision as of 21:03, 18 September 2023
New format available! This reference is now available in a new format that offers faster page load, improved display for calculations and images and more targeted search.
As of January 2024, this Reliawiki page will not continue to be updated. Please update all links and bookmarks to the latest references at BlockSim examples and BlockSim reference examples.
This example also appears in the System analysis reference.
Consider the simple system shown in the figure below, but with [math]\displaystyle{ E\,\! }[/math] operating.
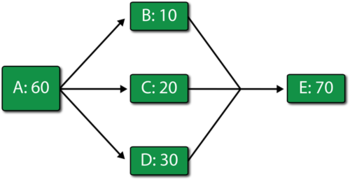
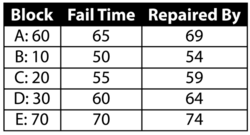
In addition, consider the following deterministic failure and repair characteristics:

Also:
- Set all units to operate through system failure.
- Do not add spare part pools or crews (use defaults).
- Do not send items to failed units.
- Use a weighted allocation scheme.
Event History: 0 to 100 Time Units
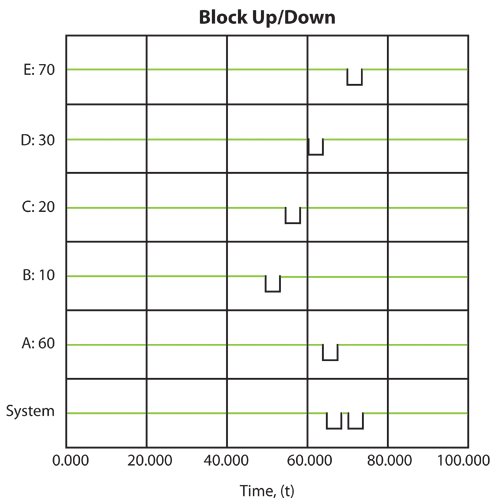
Then the system behavior from 0 to 100 time units is given in the table below. The system event history is as follows:
Once the system history has been established, we can examine the throughput behavior of this system from 0 to 100 by observing the sequence of events and their subsequent effect on system throughput.
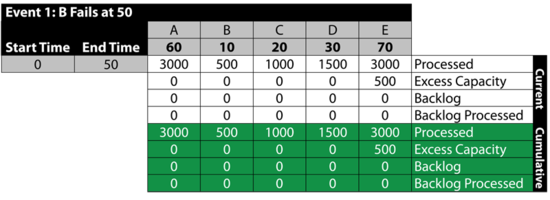
Event 1: B Fails at 50
- • At 50, B fails.
- • From 0 to 50, A processes [math]\displaystyle{ 50\cdot 60=3000\,\! }[/math] items.
- • 500 are sent to B , 1000 to [math]\displaystyle{ C\,\! }[/math] and 1500 to [math]\displaystyle{ D\,\! }[/math]. There is no excess capacity at B , [math]\displaystyle{ C\,\! }[/math] or [math]\displaystyle{ D\,\! }[/math].
- • B , [math]\displaystyle{ C\,\! }[/math] and [math]\displaystyle{ D\,\! }[/math] process and send 3000 items to [math]\displaystyle{ E\,\! }[/math]. Because the capacity of [math]\displaystyle{ E\,\! }[/math] is 3500, [math]\displaystyle{ E\,\! }[/math] now has an excess capacity of 500.
- • The next table summarizes these results:
Event 2: B is Down 50 to 54
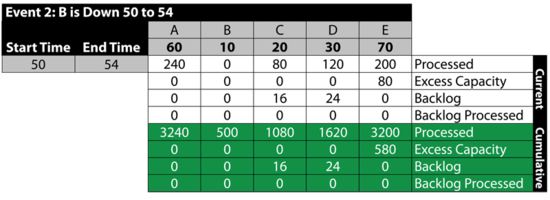
- • From 50 to 54, B is down.
- • A processes 240 items and sends 96 to [math]\displaystyle{ C\,\! }[/math] and 144 to [math]\displaystyle{ D\,\! }[/math].
- • [math]\displaystyle{ D\,\! }[/math] and [math]\displaystyle{ C\,\! }[/math] can only process 80 and 120 respectively during this time. Thus, they get backlogs of 16 and 24 respectively.
- • The 200 processed are sent to [math]\displaystyle{ E\,\! }[/math]. [math]\displaystyle{ E\,\! }[/math] has an excess capacity of 80 during this time period.
- • The next table summarizes these results:
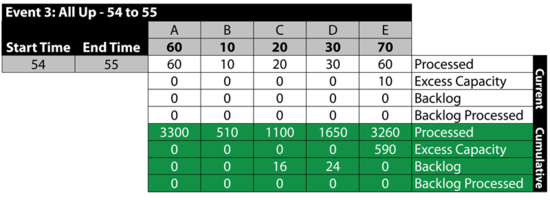
Event 3: All Up 54 to 55
The next table summarizes the results:
Event 4: [math]\displaystyle{ C\,\! }[/math] is Down 55 to 59
The next table summarizes the results:

Event 5: All Up 59 to 60
The next table summarizes the results:

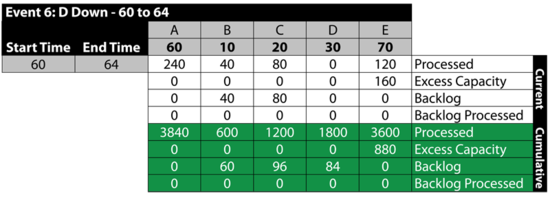
Event 6: [math]\displaystyle{ D\,\! }[/math] is Down 60 to 64
The next table summarizes the results:
Event 7: All Up 64 to 65
The next table summarizes the results:

Event 8: A is Down 65 to 69
Between 65 and 69, A fails. This stops the flow of items in the system and provides an opportunity for the other blocks to process their backlogs. As an example, B processes 40 items from the 60 items in its backlog. Specifically:

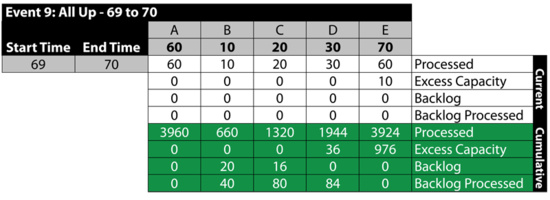
Event 9: All Up 69 to 70
The next table summarizes the results:
Event 10: [math]\displaystyle{ E\,\! }[/math] is Down 60 to 64
From 70 to 74, [math]\displaystyle{ E\,\! }[/math] is down. Because we specified that we will not send items to failed units, B , [math]\displaystyle{ C\,\! }[/math] and [math]\displaystyle{ D\,\! }[/math] receive items from A but they do not process them, since processing would require that items be sent to [math]\displaystyle{ E\,\! }[/math]. The items received by B , [math]\displaystyle{ C\,\! }[/math] and [math]\displaystyle{ D\,\! }[/math] are added to their respective backlogs. Furthermore, since they could have processed them if [math]\displaystyle{ E\,\! }[/math] had been up, all three blocks have an excess capacity for this period. Specifically:
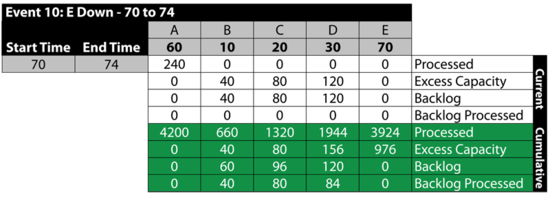
It should be noted that if we had allowed items to be sent to failed blocks, B , [math]\displaystyle{ C\,\! }[/math] and [math]\displaystyle{ D\,\! }[/math] would have processed the items received and the backlog would have been at [math]\displaystyle{ E\,\! }[/math]. The rest of the time, all units are up.
Event 11: All Up 74 to 100
The next table summarizes the results:

Exploring the Results
BlockSim provides all of these results via the Simulation Results Explorer. The figure below shows the system throughput summary.
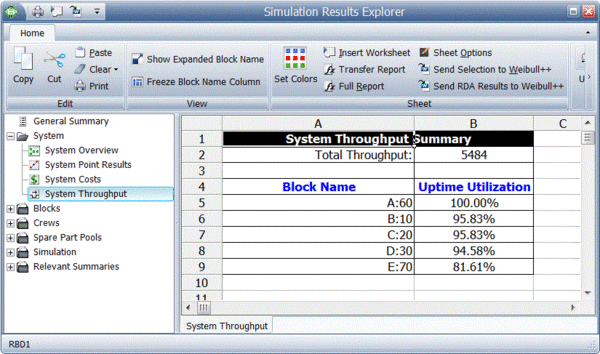
System level results present the total system throughput, which is 5484 items in this example. Additionally, the results include the uptime utilization of each component. The block level result summary, shown next, provides additional results for each item.
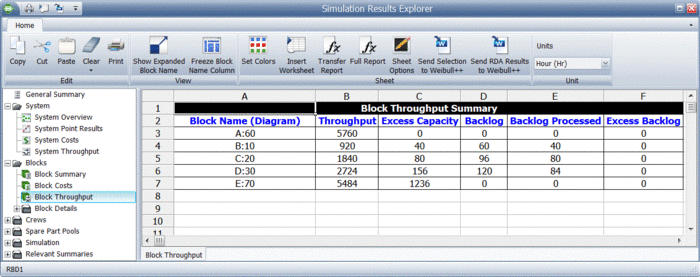
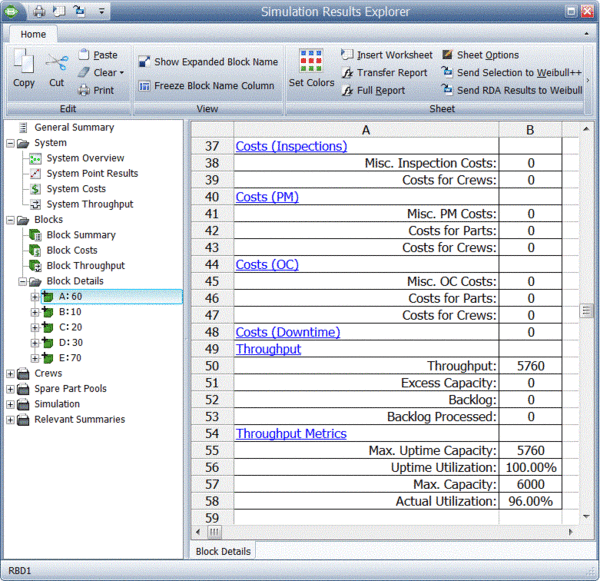
Finally, specific throughput results and metrics for each block are provided, as shown next.
