T-H Example: Difference between revisions
Kate Racaza (talk | contribs) (updated banner) |
Lisa Hacker (talk | contribs) No edit summary |
||
| (4 intermediate revisions by 2 users not shown) | |||
| Line 1: | Line 1: | ||
<noinclude>{{Banner_ALTA_Examples}} | <noinclude>{{Banner_ALTA_Examples}} | ||
</noinclude>The following data were collected after testing twelve electronic devices at different temperature and humidity conditions: | ''This example appears in the [https://help.reliasoft.com/reference/accelerated_life_testing_data_analysis Accelerated life testing reference].'' | ||
</noinclude> | |||
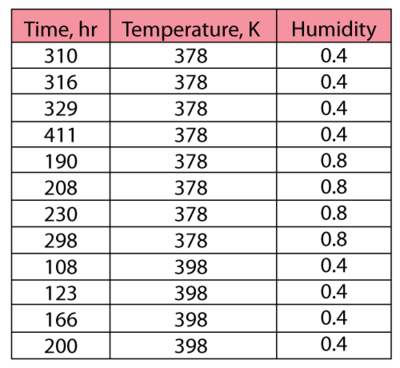
The following data were collected after testing twelve electronic devices at different temperature and humidity conditions: | |||
[[Image:ex1chp9.png|center|400px|]] | [[Image:ex1chp9.png|center|400px|]] | ||
Using ALTA, the following results were obtained: | Using ALTA, the following results were obtained: | ||
::<math>\begin{align} | ::<math>\begin{align} | ||
\widehat{\beta }=\ & 5.874395 \\ | \widehat{\beta }=\ & 5.874395 \\ | ||
| Line 17: | Line 17: | ||
& & \\ | & & \\ | ||
\widehat{\phi}=\ & 5630.329851 | \widehat{\phi}=\ & 5630.329851 | ||
\end{align}</math> | \end{align}\,\!</math> | ||
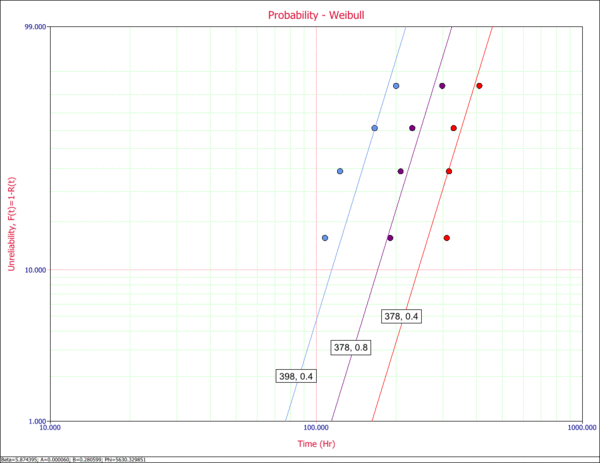
A probability plot for the entered data is shown next. | A probability plot for the entered data is shown next. | ||
[[Image:ALTA9probabilityplot.gif|center|600px|Probability plots at the tested combinations.]] | |||
[[Image:ALTA9probabilityplot.gif|center| | |||
Note that three lines are plotted because there are three combinations of stresses, namely, (398K, 0.4), (378K, 0.8) and (378K, 0.4). | Note that three lines are plotted because there are three combinations of stresses, namely, (398K, 0.4), (378K, 0.8) and (378K, 0.4). | ||
| Line 30: | Line 27: | ||
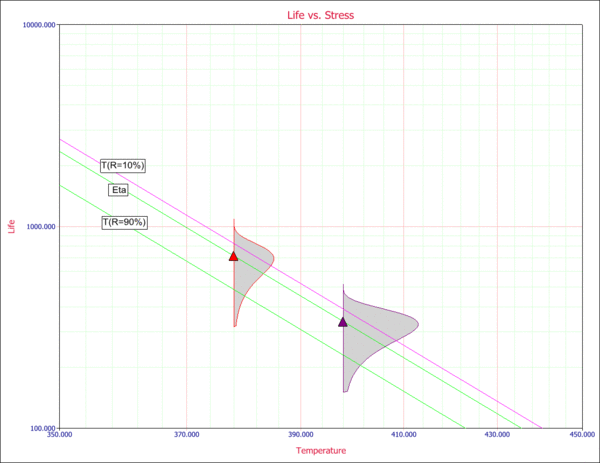
Given the use stress levels, time estimates can be obtained for a specified probability. A Life vs. Stress plot can be obtained if one of the stresses is kept constant. For example, the following picture shows a Life vs. Temperature plot at a constant humidity of 0.4. | Given the use stress levels, time estimates can be obtained for a specified probability. A Life vs. Stress plot can be obtained if one of the stresses is kept constant. For example, the following picture shows a Life vs. Temperature plot at a constant humidity of 0.4. | ||
[[Image:ALTA9stressplot.gif|center|600px|Life vs. Temperature plot with humidity fixed at 0.4.]] | |||
[[Image:ALTA9stressplot.gif|center| | |||
Latest revision as of 19:03, 18 September 2023
New format available! This reference is now available in a new format that offers faster page load, improved display for calculations and images and more targeted search.
As of January 2024, this Reliawiki page will not continue to be updated. Please update all links and bookmarks to the latest references at ALTA examples and ALTA reference examples.
This example appears in the Accelerated life testing reference.
The following data were collected after testing twelve electronic devices at different temperature and humidity conditions:
Using ALTA, the following results were obtained:
- [math]\displaystyle{ \begin{align} \widehat{\beta }=\ & 5.874395 \\ & & \\ \widehat{A}=\ & 0.000060 \\ & & \\ \widehat{b}=\ & 0.280599 \\ & & \\ \widehat{\phi}=\ & 5630.329851 \end{align}\,\! }[/math]
A probability plot for the entered data is shown next.
Note that three lines are plotted because there are three combinations of stresses, namely, (398K, 0.4), (378K, 0.8) and (378K, 0.4).
Given the use stress levels, time estimates can be obtained for a specified probability. A Life vs. Stress plot can be obtained if one of the stresses is kept constant. For example, the following picture shows a Life vs. Temperature plot at a constant humidity of 0.4.


