Monte Carlo Simulation Example: Difference between revisions
Kate Racaza (talk | contribs) mNo edit summary |
Lisa Hacker (talk | contribs) No edit summary |
||
| (6 intermediate revisions by 4 users not shown) | |||
| Line 1: | Line 1: | ||
<noinclude>{{Banner Weibull Examples}} | <noinclude>{{Banner Weibull Examples}} | ||
''This example appears in the [ | ''This example appears in the [https://help.reliasoft.com/reference/life_data_analysis Life data analysis reference]''. | ||
</noinclude>Monte Carlo simulation can be used to perform simple relationship-based simulations. This type of simulation has many applications in probabilistic design, risk analysis, quality control, etc. The Monte Carlo utility includes a ''User Defined'' distribution feature that allows you to specify an equation relating different random variables. The following example uses the Life Comparison tool to compare the ''pdf'' of two user-defined distributions. A variation of the example | </noinclude>Monte Carlo simulation can be used to perform simple relationship-based simulations. This type of simulation has many applications in probabilistic design, risk analysis, quality control, etc. The Monte Carlo utility includes a ''User Defined'' distribution feature that allows you to specify an equation relating different random variables. The following example uses the Life Comparison tool to compare the ''pdf'' of two user-defined distributions. A variation of the example that demonstrates how to obtain the joint ''pdf'' of random variables is available in the [https://help.reliasoft.com/weibull23/content/user-defined_equation_example.htm Weibull++ help file]. | ||
'''Monte Carlo Simulation: A Hinge Length Example''' | '''Monte Carlo Simulation: A Hinge Length Example''' | ||
A hinge is made up of four components A, B, C, D, as shown next. Seven units of each component were taken from the assembly line and measurements (in cm) were recorded. | A hinge is made up of four components A, B, C, D, as shown next. Seven units of each component were taken from the assembly line and measurements (in cm) were recorded. | ||
[[Image:WB.23 lda26.1.png|center|250px| ]] | [[Image:WB.23 lda26.1.png|center|250px| ]] | ||
The following table shows the measurements. Determine the probability that D will fall out of specifications. | The following table shows the measurements. Determine the probability that D will fall out of specifications. | ||
::<center><math>\begin{matrix} | ::<center><math>\begin{matrix} | ||
| Line 26: | Line 22: | ||
\text{2}\text{.0273} & \text{2}\text{.0354} & \text{30}\text{.1343} & \text{35}\text{.2666} \\ | \text{2}\text{.0273} & \text{2}\text{.0354} & \text{30}\text{.1343} & \text{35}\text{.2666} \\ | ||
\text{1}\text{.984} & \text{1}\text{.9908} & \text{30}\text{.0423} & \text{35}\text{.7111} \\ | \text{1}\text{.984} & \text{1}\text{.9908} & \text{30}\text{.0423} & \text{35}\text{.7111} \\ | ||
\end{matrix}</math></center> | \end{matrix}\,\!</math></center> | ||
'''Solution''' | '''Solution''' | ||
In a Weibull++ standard folio, enter the parts dimensions measurements of each component into separate data sheets. Analyze each data sheet using the normal distribution and the RRX analysis method. The parameters are: | In a Weibull++ standard folio, enter the parts dimensions measurements of each component into separate data sheets. Analyze each data sheet using the normal distribution and the RRX analysis method. The parameters are: | ||
::<center><math>\begin{matrix} | ::<center><math>\begin{matrix} | ||
| Line 38: | Line 32: | ||
\hat{\mu }=2.0146 & \hat{\mu }=2.0096 & \hat{\mu }=30.0981 & \hat{\mu }=34.8149 \\ | \hat{\mu }=2.0146 & \hat{\mu }=2.0096 & \hat{\mu }=30.0981 & \hat{\mu }=34.8149 \\ | ||
\hat{\sigma }=0.0181 & \hat{\sigma }=0.0249 & \hat{\sigma }=0.1762 & \hat{\sigma }=0.7121 \\ | \hat{\sigma }=0.0181 & \hat{\sigma }=0.0249 & \hat{\sigma }=0.1762 & \hat{\sigma }=0.7121 \\ | ||
\end{matrix}</math></center> | \end{matrix}\,\!</math></center> | ||
Next, perform a Monte Carlo simulation to estimate the probability that (A+B+C) will be greater than D. To do this, choose the '''User Defined''' distribution and enter its equation as follows. (Click the '''Insert Data Source''' button to insert the data sheets that contain the measurements for the components.) | Next, perform a Monte Carlo simulation to estimate the probability that (A+B+C) will be greater than D. To do this, choose the '''User Defined''' distribution and enter its equation as follows. (Click the '''Insert Data Source''' button to insert the data sheets that contain the measurements for the components.) | ||
[[Image:Rsik Analysis Example Monte Carlo Setting.png|center|550px| ]] | [[Image:Rsik Analysis Example Monte Carlo Setting.png|center|550px| ]] | ||
On the Settings tab, set the number of data points to '''100''', as shown next. | On the Settings tab, set the number of data points to '''100''', as shown next. | ||
[[Image:Rsik Analysis Example Monte Carlo Number of Points.png|center|550px| ]] | [[Image:Rsik Analysis Example Monte Carlo Number of Points.png|center|550px| ]] | ||
Click '''Generate''' to create a data sheet that contains the generated data points. Rename the new data sheet to "Simulated A+B+C." | Click '''Generate''' to create a data sheet that contains the generated data points. Rename the new data sheet to "Simulated A+B+C." | ||
| Line 57: | Line 46: | ||
Follow the same procedure to generate 100 data points to represent the D measurements. Rename the new data sheet to "Simulated D." | Follow the same procedure to generate 100 data points to represent the D measurements. Rename the new data sheet to "Simulated D." | ||
[[Image:Rsik Analysis Example Monte Carlo D.png|center|550px| ]] | |||
[[Image:Rsik Analysis Example Monte Carlo D.png | |||
Analyze the two data sets, "Simulated A+B+C" and "Simulated D," using the normal distribution and the RRX analysis method. | Analyze the two data sets, "Simulated A+B+C" and "Simulated D," using the normal distribution and the RRX analysis method. | ||
| Line 65: | Line 52: | ||
Next, open the Life Comparison tool and choose to compare the two data sheets. The following picture shows the ''pdf'' curves of the two data sets. | Next, open the Life Comparison tool and choose to compare the two data sheets. The following picture shows the ''pdf'' curves of the two data sets. | ||
[[Image:Rsik Analysis Example Selected Life Comparison Plot.png|center|550px| ]] | |||
[[Image:Rsik Analysis Example Selected Life Comparison Plot.png | |||
The following report shows that the probability that "Simulated A+B+C" will be greater than "Simulated D" is 16.033%. (Note that the results may vary because of the randomness in the simulation.) | The following report shows that the probability that "Simulated A+B+C" will be greater than "Simulated D" is 16.033%. (Note that the results may vary because of the randomness in the simulation.) | ||
[[Image:Rsik Analysis Example Selected Life Comparison Result.png|center|550px| ]] | |||
[[Image:Rsik Analysis Example Selected Life Comparison Result.png | |||
Latest revision as of 18:56, 18 September 2023
New format available! This reference is now available in a new format that offers faster page load, improved display for calculations and images and more targeted search.
As of January 2024, this Reliawiki page will not continue to be updated. Please update all links and bookmarks to the latest references at Weibull examples and Weibull reference examples.
This example appears in the Life data analysis reference.
Monte Carlo simulation can be used to perform simple relationship-based simulations. This type of simulation has many applications in probabilistic design, risk analysis, quality control, etc. The Monte Carlo utility includes a User Defined distribution feature that allows you to specify an equation relating different random variables. The following example uses the Life Comparison tool to compare the pdf of two user-defined distributions. A variation of the example that demonstrates how to obtain the joint pdf of random variables is available in the Weibull++ help file.
Monte Carlo Simulation: A Hinge Length Example
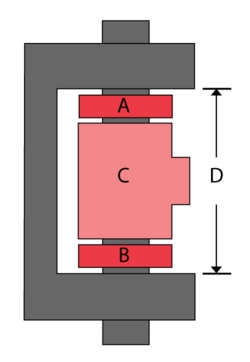
A hinge is made up of four components A, B, C, D, as shown next. Seven units of each component were taken from the assembly line and measurements (in cm) were recorded.
The following table shows the measurements. Determine the probability that D will fall out of specifications.
[math]\displaystyle{ \begin{matrix} \text{Dimensions for A} & \text{Dimensions for B} & \text{Dimensions for C} & \text{Dimensions for D} \\ \text{2}\text{.0187} & \text{1}\text{.9795} & \text{30}\text{.4216} & \text{33}\text{.6573} \\ \text{1}\text{.9996} & \text{2}\text{.0288} & \text{29}\text{.9818} & \text{34}\text{.5432} \\ \text{2}\text{.0167} & \text{1}\text{.9883} & \text{29}\text{.9724} & \text{34}\text{.6218} \\ \text{2}\text{.0329} & \text{2}\text{.0327} & \text{30}\text{.192} & \text{34}\text{.7538} \\ \text{2}\text{.0233} & \text{2}\text{.0119} & \text{29}\text{.9421} & \text{35}\text{.1508} \\ \text{2}\text{.0273} & \text{2}\text{.0354} & \text{30}\text{.1343} & \text{35}\text{.2666} \\ \text{1}\text{.984} & \text{1}\text{.9908} & \text{30}\text{.0423} & \text{35}\text{.7111} \\ \end{matrix}\,\! }[/math]
Solution
In a Weibull++ standard folio, enter the parts dimensions measurements of each component into separate data sheets. Analyze each data sheet using the normal distribution and the RRX analysis method. The parameters are:
[math]\displaystyle{ \begin{matrix} \text{A} & \text{B} & \text{C} & \text{D} \\ \hat{\mu }=2.0146 & \hat{\mu }=2.0096 & \hat{\mu }=30.0981 & \hat{\mu }=34.8149 \\ \hat{\sigma }=0.0181 & \hat{\sigma }=0.0249 & \hat{\sigma }=0.1762 & \hat{\sigma }=0.7121 \\ \end{matrix}\,\! }[/math]
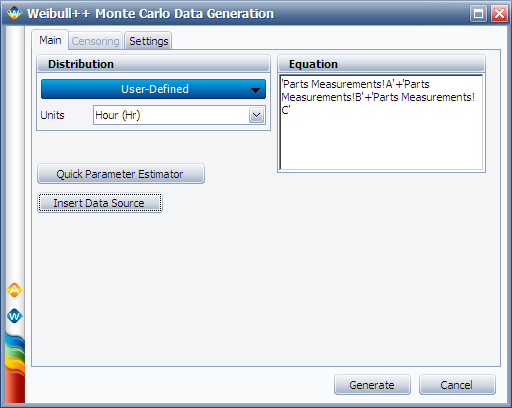
Next, perform a Monte Carlo simulation to estimate the probability that (A+B+C) will be greater than D. To do this, choose the User Defined distribution and enter its equation as follows. (Click the Insert Data Source button to insert the data sheets that contain the measurements for the components.)
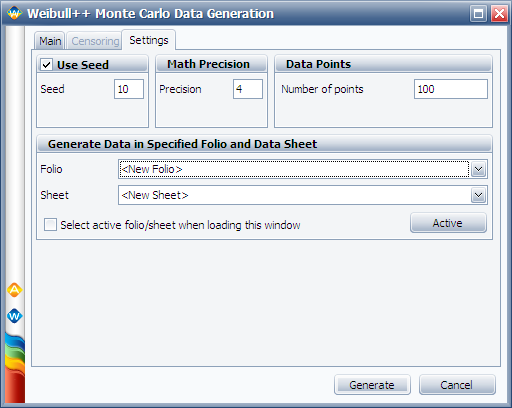
On the Settings tab, set the number of data points to 100, as shown next.
Click Generate to create a data sheet that contains the generated data points. Rename the new data sheet to "Simulated A+B+C."
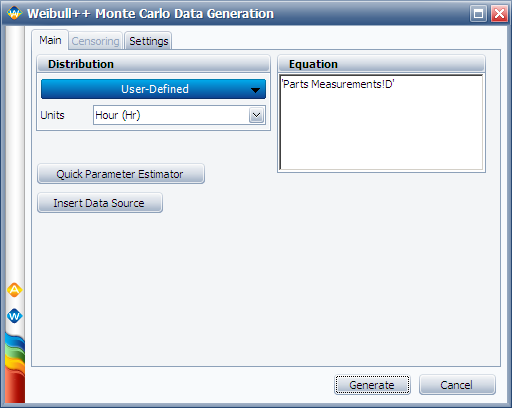
Follow the same procedure to generate 100 data points to represent the D measurements. Rename the new data sheet to "Simulated D."
Analyze the two data sets, "Simulated A+B+C" and "Simulated D," using the normal distribution and the RRX analysis method.
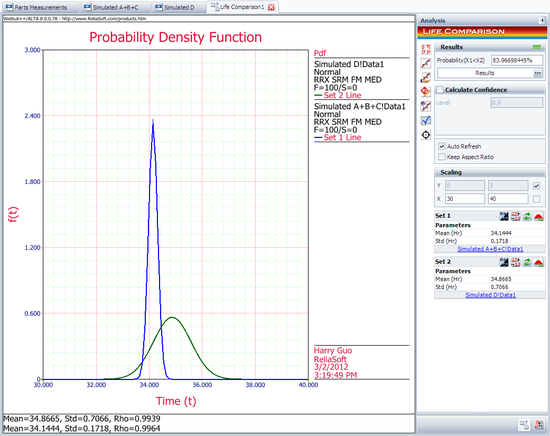
Next, open the Life Comparison tool and choose to compare the two data sheets. The following picture shows the pdf curves of the two data sets.
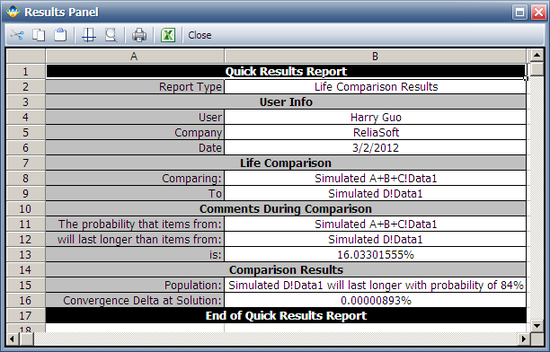
The following report shows that the probability that "Simulated A+B+C" will be greater than "Simulated D" is 16.033%. (Note that the results may vary because of the randomness in the simulation.)

