Maintenance Planning Example: Difference between revisions
John Leavitt (talk | contribs) No edit summary |
Lisa Hacker (talk | contribs) No edit summary |
||
| Line 1: | Line 1: | ||
<noinclude> | <noinclude> | ||
{{Banner Weibull Examples}} | {{Banner Weibull Examples}} | ||
''This example appears in the [ | ''This example appears in the [https://help.reliasoft.com/reference/life_data_analysis Life data analysis reference]''. | ||
</noinclude> | </noinclude> | ||
Latest revision as of 18:56, 18 September 2023
New format available! This reference is now available in a new format that offers faster page load, improved display for calculations and images and more targeted search.
As of January 2024, this Reliawiki page will not continue to be updated. Please update all links and bookmarks to the latest references at Weibull examples and Weibull reference examples.
This example appears in the Life data analysis reference.
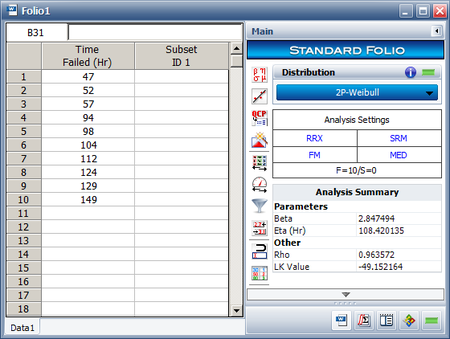
Assume that we are going to use the Maintenance Planning tool in Weibull++ to analyze a device that is assembled as part of a system. The failure times of the device are recorded and a Weibull distribution is used to model the data. The following picture shows the Weibull++ standard folio that contains the data and distribution. The Weibull distribution has parameters [math]\displaystyle{ \beta\,\! }[/math] = 2.847494 and [math]\displaystyle{ \eta\,\! }[/math] = 108.420135.
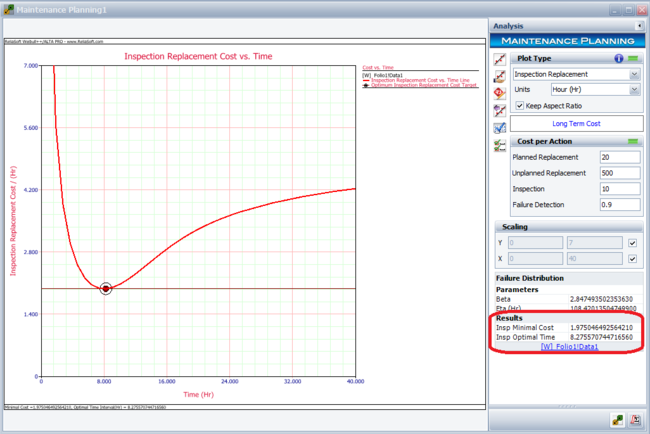
Assume that the average cost for a planned replacement of the device is $20. For an unplanned replacement, the cost is $500. The cost for each inspection is $10, and the fraction of the failure time for detecting an oncoming failure is 0.9. The objectives are:
- Find the optimal inspection interval and the optimal scheduled replacement interval for minimizing the cost in the long term.
- Find the optimal inspection interval and the optimal scheduled replacement interval for minimizing the cost in one replacement cycle.
Solution
In the Maintenance Planning tool, choose the Inspection Replacement plot type on the control panel, and then enter the estimated costs. Click the Plot icon to calculate the results and draw the plot. The following results show that the optimal inspection interval is about 8.28 hours, and the minimal cost is about $1.98 per hour.
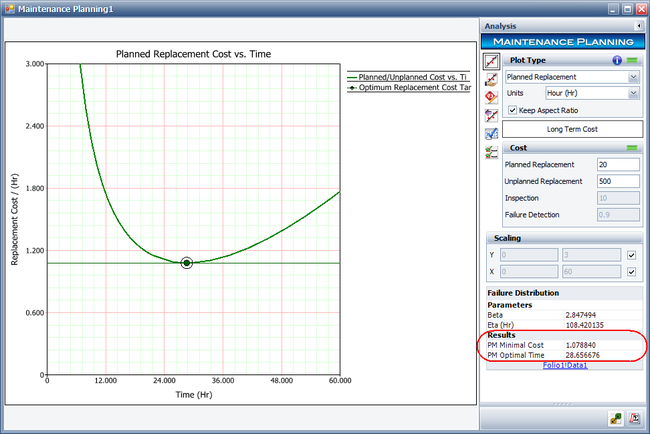
To use a scheduled replacement strategy, choose the Planned Replacement plot type on the control panel, and then click the Plot icon again to recalculate results and redraw the plot. The following results show that the optimal replacement interval is about 28.657 hours, and the minimal cost is about $1.079 per hour.
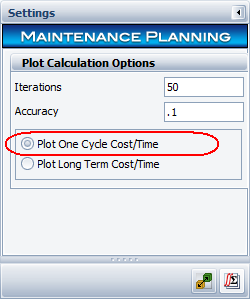
To find the optimal times for minimizing the cost in one replacement cycle, select the Plot One Cycle Cost/Time option on the Settings page of the control panel.
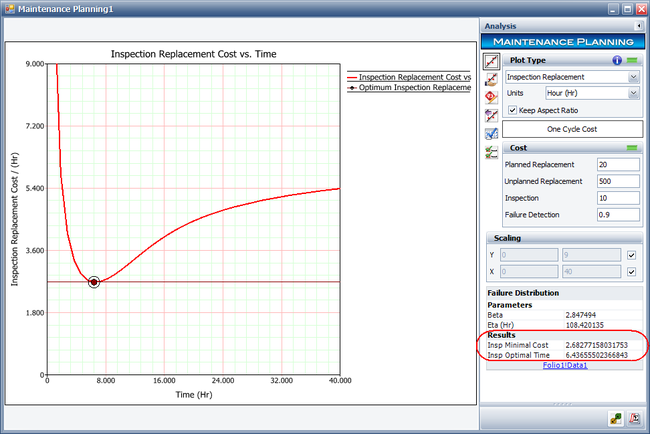
Next, choose the Inspection Replacement plot type on the Main page of the control panel and recalculate the results. The results show that the optimal inspection interval for one replacement cycle is about 6.437 hours, and the minimal cost is about $2.683 per hour.
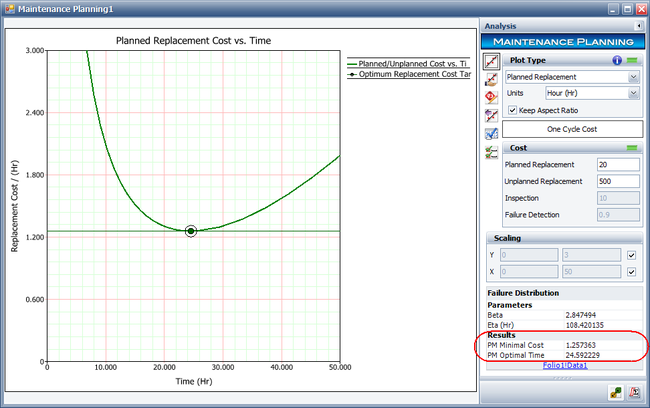
Change the plot type to Planned Replacement and recalculate the results. The results show that the optimal replacement interval is about 24.592 hours, and the minimal cost is about $1.257 per hour.
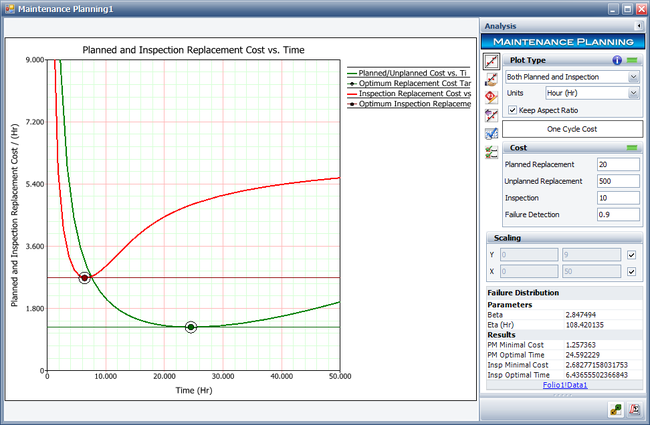
To plot both the planned replacement and inspection replacement plots, choose the Both Planned and Inspection plot type. The results are shown next.
Based on the above results, we can now make decisions about our maintenance strategy. For example, if our plan is to reduce the short term maintenance cost, then the device should be scheduled for replacement at about every 24 hours. This will give us a minimal maintenance cost of $1.257 per hour.

