Component Importance Reference Example: Difference between revisions
Jump to navigation
Jump to search
Kate Racaza (talk | contribs) (Created page with '{{Reference Example|{{Banner BlockSim Reference Examples}}}} This example validates the component importance results for BlockSim's analytical and simulation diagrams. {{Refer…') |
No edit summary |
||
| (2 intermediate revisions by one other user not shown) | |||
| Line 1: | Line 1: | ||
{{Reference Example|{{Banner BlockSim Reference Examples}}}} | {{Reference Example|{{Banner BlockSim Reference Examples}}}} | ||
This example validates the component importance results for BlockSim | This example validates the component importance results for BlockSim diagrams. | ||
| Line 11: | Line 11: | ||
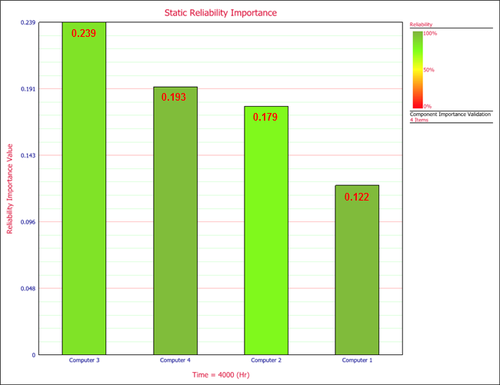
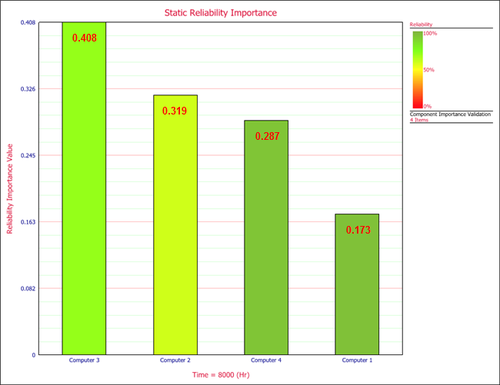
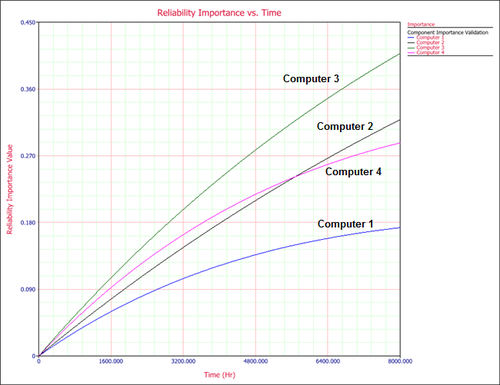
A computing system with four computers is configured as given in the BlockSim flowchart diagram below. (Please see Figure 4.29 on page 100 in the reference book for the original configuration.) Each computer follows an exponentially distributed failure rate with the given failure rate parameters in the table below. The Birnbaum’s importance measures of each computer in the system at 4000 and 8000 hours of operation are sought in this example. The system reliability equation, the reliabilities of each computer at the given times and the reliability importance at different times are also scrutinized. | A computing system with four computers is configured as given in the BlockSim flowchart diagram below. (Please see Figure 4.29 on page 100 in the reference book for the original configuration.) Each computer follows an exponentially distributed failure rate with the given failure rate parameters in the table below. The Birnbaum’s importance measures of each computer in the system at 4000 and 8000 hours of operation are sought in this example. The system reliability equation, the reliabilities of each computer at the given times and the reliability importance at different times are also scrutinized. | ||
{| {{Table}} | {| {{Table}} | ||
| Line 29: | Line 26: | ||
{{ | {{Reference_Example_Heading3}} | ||
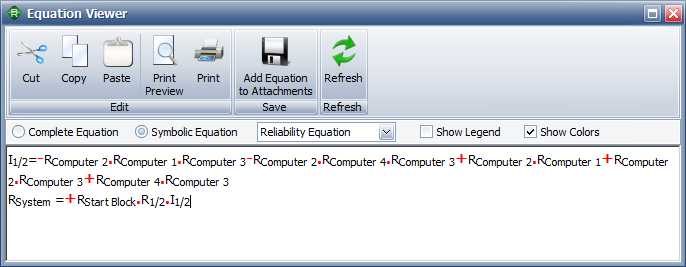
The system reliability equation is computed from Equation 4.40 on page 87 as: | The system reliability equation is computed from Equation 4.40 on page 87 as: | ||
| Line 52: | Line 49: | ||
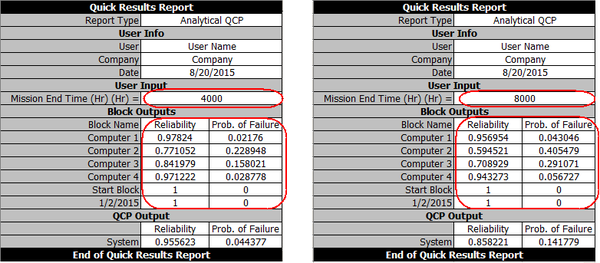
:<math>\begin{align} | :<math>\begin{align} | ||
R_{C1}(8000)&=0.9570; R_{C2}(8000) = 0.5945\\ | R_{C1}(8000)&=0.9570; R_{C2}(8000) = 0.5945\\ | ||
R_{C3}(8000)&=0.7089; R_{C2}(8000) = 0. | R_{C3}(8000)&=0.7089; R_{C2}(8000) = 0.9433\\ | ||
\end{align}\,\!</math> | \end{align}\,\!</math> | ||
| Line 61: | Line 58: | ||
Birnbaum’s importance measures for each computer can be formulated via Equation 4.59 on page 100 as: | |||
:<math>I_{B}(i|t)= \frac{\partial R(t)}{\partial R_{i}(t)}\,\!</math> | :<math>I_{B}(i|t)= \frac{\partial R(t)}{\partial R_{i}(t)}\,\!</math> | ||
| Line 67: | Line 64: | ||
:<math>I_{B}(C1|t)= R_{2}(1-R_{3}); I_{B}(C2|t) = R_{1}+R_{3}-R_{1}R_{3}-R_{3}R_{4}\,\!</math> | :<math>I_{B}(C1|t)= R_{2}(1-R_{3}); I_{B}(C2|t) = R_{1}+R_{3}-R_{1}R_{3}-R_{3}R_{4}\,\!</math> | ||
:<math>I_{B}(C3|t)= R_{2}+ R_{4}- R_{1}R_{2} - R_{2}R_{4}; I_{B}(C4|t) = R_{3}(1 - R_{2}\,\!</math> | :<math>I_{B}(C3|t)= R_{2}+ R_{4}- R_{1}R_{2} - R_{2}R_{4}; I_{B}(C4|t) = R_{3}(1 - R_{2})\,\!</math> | ||
Therefore, the values of the importance measures can be calculated at 4000 and 8000 hours of operation as: | |||
:<math>\begin{align} | |||
I_{B}(C1|4000)&= 0.1218; I_{B}(C2|4000)= 0.1788\\ | |||
I_{B}(C3|4000)&= 0.2391; I_{B}(C4|4000)= 0.1928\\ | |||
\end{align}\,\!</math> | |||
and | |||
:<math>\begin{align} | |||
I_{B}(C1|8000)&= 0.1730; I_{B}(C2|8000)= 0.3188\\ | |||
I_{B}(C3|8000)&= 0.4081; I_{B}(C4|8000)= 0.2875\\ | |||
\end{align}\,\!</math> | |||
Please note that there is a printing error in the reference book and the importance measure for Computer 4 at 8000 hours is printed as 0.2975 instead of 0.2875. | |||
{{Reference_Example_Heading4|BlockSim}} | |||
In BlockSim, the computer system RBD is configured as shown below. | |||
[[Image:importance_rbd.png|center]] | |||
Each computer is modeled using a 1-parameter exponential distribution with the given lambda (failure rate) values. | |||
The reliability equation for the computer system can be viewed via the Equation Viewer. The resulting equation is the same as the one computed in the reference book. | |||
[[Image:importance_eqnviewer.png|center]] | |||
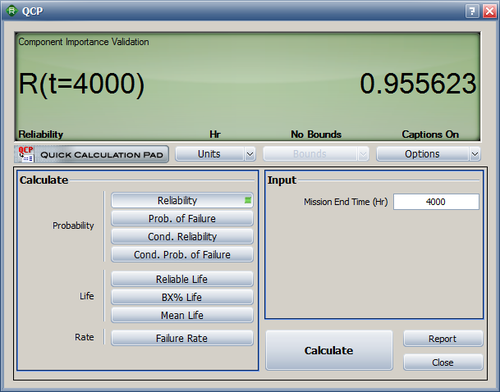
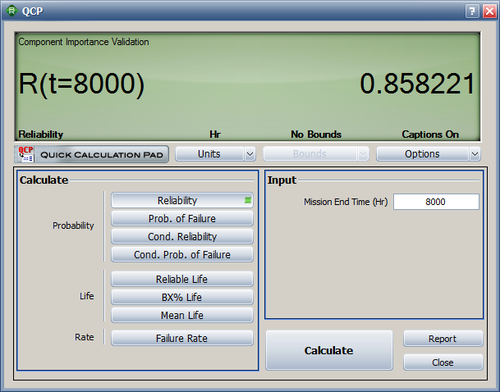
The system reliabilities at 4000 and 8000 hours are calculated in the QCP as R(4000) = 95.56% and R(8000) = 85.82%. The values are the same as the ones in the reference book. | |||
[[Image:importance_qcp1.png|center|500px|Reliability at 4000 hours.]] | |||
[[Image:importance_qcp2.png|center|500px|Reliability at 8000 hours.]] | |||
The QCP report (accessed by clicking the '''Report''' button in the QCP window) shows the reliabilities of each computer at the given times (4000 and 8000 hours). | |||
[[Image:importance_qcpreport.png|center|600px]] | |||
The static reliability importance for each computer at 4000 hours is presented below in graphical format, with the values highlighted in red. The color of each bar represents the computer’s reliability. | |||
[[Image:importance_plot1.png|center|500px|Reliability importance at 4000 hours.]] | |||
The static reliability importance for each computer at 8000 hours is shown next. | |||
[[Image:importance_plot2.png|center|500px|Reliability importance at 8000 hours.]] | |||
The following plot shows the reliability importance for the individual computers at different times. | |||
[[Image:importance_plot3.png|center|500px]] | |||
Latest revision as of 14:39, 8 August 2016
New format available! This reference is now available in a new format that offers faster page load, improved display for calculations and images and more targeted search.
As of January 2024, this Reliawiki page will not continue to be updated. Please update all links and bookmarks to the latest references at BlockSim examples and BlockSim reference examples.


