Three Level Compromise Test Plan for One Stress: Difference between revisions
Jump to navigation
Jump to search
Kate Racaza (talk | contribs) No edit summary |
Kate Racaza (talk | contribs) No edit summary |
||
| (4 intermediate revisions by the same user not shown) | |||
| Line 1: | Line 1: | ||
{{Reference Example| | {{Reference Example|{{Banner ALTA Reference Examples}}}} | ||
This example | This example validates the results for the 3 level best compromise test plan with one stress in ALTA. | ||
{{Reference_Example_Heading1}} | {{Reference_Example_Heading1}} | ||
The data set is from Example 20.5 on page 542 in the book | The data set is from Example 20.5 on page 542 in the book ''Statistical Methods for Reliability Data'' by Dr. Meeker and Dr. Escobar, John Wiley & Sons, 1998. | ||
{{Reference_Example_Heading2}} | {{Reference_Example_Heading2}} | ||
A Weibull distribution with Arrhenius relationship is used. The Arrhenius relationship uses the following formula: | A Weibull distribution with an Arrhenius life-stress relationship is used. The Arrhenius relationship uses the following formula: | ||
::<math>ln(\eta) = \beta_{0} + \beta_{1} \times \frac{11605}{T}\,\!</math> | ::<math>ln(\eta) = \beta_{0} + \beta_{1} \times \frac{11605}{T}\,\!</math> | ||
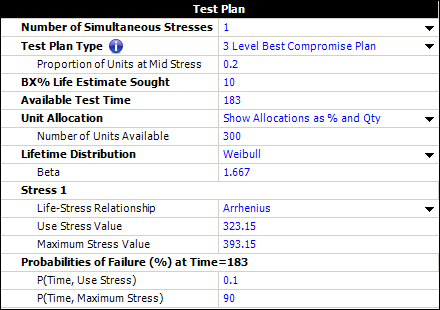
The planning values of the model parameters | The planning values of the model parameters for the test plan are <math>\beta\,\!</math> = 1.667, <math>\beta_{0}\,\!</math> = -16.7333 and <math>\beta_{1}\,\!</math> = 0.7265. These planning values were obtained based on the following assumptions: 0.1% of the units will fail in 6 months (183 hours) at 50°C, and 90% will fail in 6 months at 120°C. This information is given in Example 20.2 on page 535. | ||
The use temperature is 50°C (323.15°K) and the highest temperature used in the test is 120°C (393.15 °K). | The use temperature is 50°C (323.15°K) and the highest temperature that can be used in the test is 120°C (393.15 °K). | ||
A total of 300 units are available for testing. Three temperature levels can be used and 20% of the units will be tested at the middle temperature level. The | A total of 300 units are available for testing. Three temperature levels can be used and 20% of the units will be tested at the middle temperature level. The objectives of the test plan are to: | ||
* Determine the three temperature levels used in the test. | * Determine the three temperature levels that should be used in the test. | ||
* Determine the number of test units at the high and the low temperature | * Determine the number of test units at the high and the low temperature levels. | ||
Tests will be conducted using the created test plan. The failure data from the test | Tests will be conducted using the created test plan. The failure data from the test will be used to estimate the model parameters and the reliability model, which are then used to predict the B10 life at 50°C and its variance. Therefore, we need a test plan that will minimize the estimation variance for the B10 life at 50°C. | ||
{{Reference_Example_Heading3}} | {{Reference_Example_Heading3}} | ||
The | The 3 level compromise test plan is: | ||
* 156 units | * 156 units should be tested at 78°C (351.15°K) | ||
* 60 units | * 60 units should be tested at 98°C (371.15°K) | ||
* 84 units | * 84 units should be tested at 120°C (393.15°K) | ||
Based on this test plan, the estimated standard error for the B10 life at 50°C is <math>Ase\left [log \left(\hat{t}_{0.1}(50) \right) \right] = 0.4375\,\!</math> . | |||
| Line 48: | Line 46: | ||
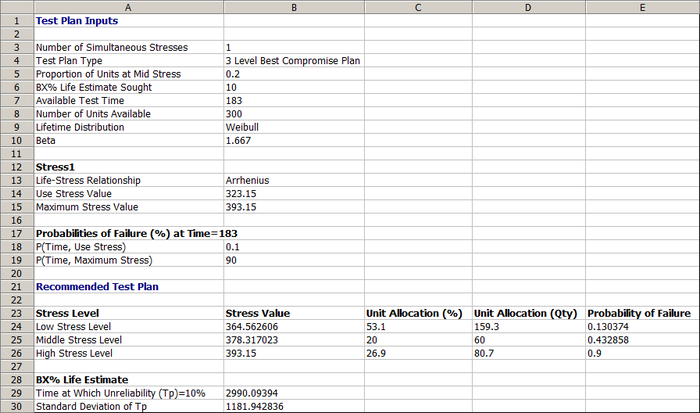
The resulting | The resulting test plan is shown below. | ||
| Line 54: | Line 52: | ||
The test plan shows that: | The test plan shows that (starting at row 24 in the picture above): | ||
* The low stress level | * The low stress level should be 364.56°K (91.41°C) and about 159 units should be tested at this temperature. | ||
* The middle stress level | * The middle stress level should be 378.32 °K (105.17°C) and about 60 units should be tested at this temperature. | ||
* The high stress level | * The high stress level should be 393.15 °K (120°C) and about 81 units should be tested at this temperature. | ||
The estimated standard deviation of the log B10 life at 50°C can be obtained by: | The estimated standard deviation of the log B10 life at 50°C can be obtained by: | ||
::<math>Ase\left[log \left(\hat{t}_{0.1}(50) \right) \right] = \frac{Ase\hat{t}_{0.1}(50)}{\hat{t}_{0.1}(50)} = \frac{1181.94}{2990.09} = 0.3953\,\!</math> | ::<math>Ase\left[log \left(\hat{t}_{0.1}(50) \right) \right] = \frac{Ase\left(\hat{t}_{0.1}(50)\right)}{\hat{t}_{0.1}(50)} = \frac{1181.94}{2990.09} = 0.3953\,\!</math> | ||
| Line 69: | Line 67: | ||
'''Using | '''Using SimuMatic to Evaluate the Test Plan''' | ||
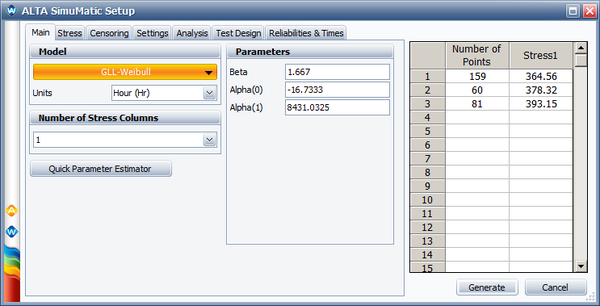
We will use the SimuMatic utility to evaluate the test plan. The following picture shows the settings used in the Main tab of SimuMatic (with <math>\alpha_{1} = \beta_{1} \times 11605\,\!</math>): | We will use the ALTA SimuMatic utility to evaluate the test plan. The following picture shows the settings used in the Main tab of SimuMatic (with <math>\alpha_{1} = \beta_{1} \times 11605\,\!</math>): | ||
[[Image: Compromise plan simumatic.png|center|600px]] | [[Image: Compromise plan simumatic.png|center|600px]] | ||
The rest of the SimuMatic | The rest of the settings in SimuMatic are as follows: | ||
* Stress tab: | * Stress tab: | ||
| Line 84: | Line 82: | ||
* Settings tab | * Settings tab | ||
::Seed = '''10''', Precision = '''4''', Number of data sets = '''1000''' | ::Seed = '''10''', Precision = '''4''', Number of data sets = '''1000''' | ||
* Reliabilities and Times | * Reliabilities and Times tab | ||
::Reliability value = '''0.9''' | ::Reliability value = '''0.9''' | ||
| Line 93: | Line 91: | ||
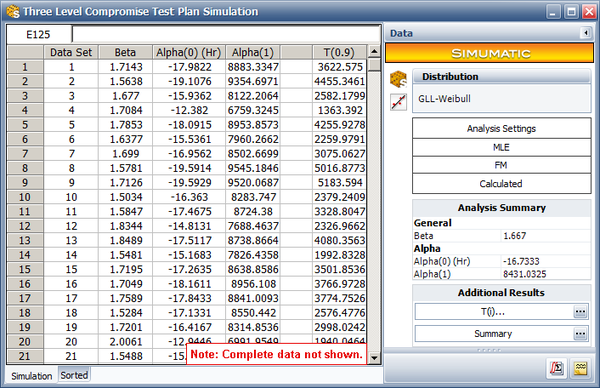
We take the | We take the natural log of the B10 life (the last column) and calculate its standard deviation. The calculated standard deviation is 0.4062. This is very close to the analytical solution from the ALTA test plan tool, where the standard deviation is 0.3953. | ||
This standard deviation is smaller than the standard deviation given by the test plan in the book. Therefore, the test plan generated in ALTA is better than the test plan given in the book in terms of minimizing the estimation variance of the B10 life. | This standard deviation is smaller than the standard deviation given by the test plan in the book. Therefore, the test plan generated in ALTA is better than the test plan given in the book in terms of minimizing the estimation variance of the B10 life. | ||
Latest revision as of 18:24, 28 September 2015
New format available! This reference is now available in a new format that offers faster page load, improved display for calculations and images and more targeted search.
As of January 2024, this Reliawiki page will not continue to be updated. Please update all links and bookmarks to the latest references at ALTA examples and ALTA reference examples.


