Test-Fix-Test Data (Failure Terminated) Reference Example: Difference between revisions
Jump to navigation
Jump to search
No edit summary |
No edit summary |
||
| Line 9: | Line 9: | ||
{{Reference_Example_Heading2}} | {{Reference_Example_Heading2}} | ||
The following table shows the data. | |||
{| {{table|12%}} | {| {{table|12%}} | ||
| Line 122: | Line 124: | ||
{{Reference_Example_Heading3}} | {{Reference_Example_Heading3}} | ||
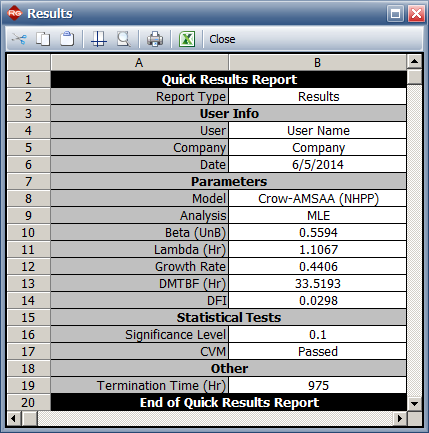
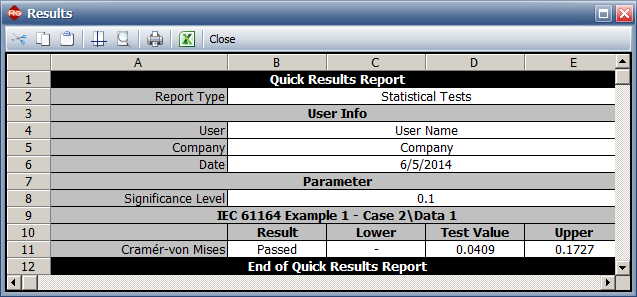
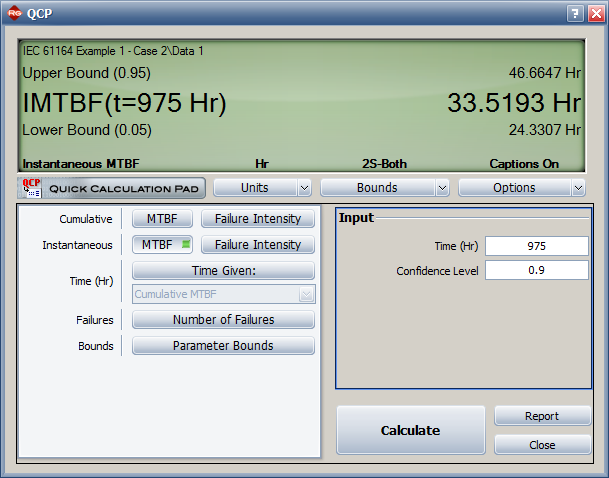
Beta(UnB) = 0.5594, Lambda = 1.1067 | The book has the following results: | ||
*Beta(UnB) = 0.5594, Lambda = 1.1067 | |||
CL = 0.9 (two-sided confidence bounds on DMTBF) | *CL = 0.9 (two-sided confidence bounds on DMTBF) | ||
DMTBF<sub>Upper</sub> = 46.7 hours | *DMTBF<sub>Upper</sub> = 46.7 hours | ||
DMTBF = 33.5 hours | *DMTBF = 33.5 hours | ||
DMTBF<sub>Lower</sub> = 24.3 hours | *DMTBF<sub>Lower</sub> = 24.3 hours | ||
CVM = 0.041, critical value = 0.173. Since CVM < critical value can fail to reject hypothesis that the model fits the data. | *CVM = 0.041, critical value = 0.173. Since CVM < critical value can fail to reject hypothesis that the model fits the data. | ||
Revision as of 15:55, 13 June 2014
RGA_Reference_Examples_Banner.png


