Warranty Data Analysis Example: Difference between revisions

From ReliaWiki
Jump to navigation Jump to search
No edit summary
No edit summary
Line 127: Line 127:


The following picture shows the parameters of the lognormal distribution and the converted failure/suspension data. The results are the same as the results shown in the book.
The following picture shows the parameters of the lognormal distribution and its associated failure/suspension data. The results are the same as the results shown in the book.


[[Image: warranty_results.png|center]]
[[Image: warranty_results.png|center]]
The following picture shows the probability plot of the lognormal distribution.
[[Image: warranty_plot.png|center|550 px]]

Revision as of 17:15, 9 June 2014

Weibull Reference Examples Banner.png


New format available! This reference is now available in a new format that offers faster page load, improved display for calculations and images and more targeted search.

As of January 2024, this Reliawiki page will not continue to be updated. Please update all links and bookmarks to the latest references at Weibull examples and Weibull reference examples.

Warranty Data Analysis Example

This example compares the warranty data analysis results.


Reference Case

The data set is from Example 11.2 on page 453 in the book Life Cycle Reliability Engineering by Dr. Guangbin Yang, John Wiley & Sons, 2007.


Data

A Nevada chart for the warranty data is provided in Table 11.3. The last two rows were combined, as specified in the example.

TTF
TIS 1 2 3 4 5 6 7 8 9 10 11 12 Total Sales Volume
12 3 0 3 3 4 2 1 5 4 2 3 3 45 2123
11 0 1 2 0 4 2 1 2 0 4 3 30 1853
10 1 3 2 2 3 4 3 5 4 8 45 2238
9 1 2 0 3 4 2 2 3 6 32 3052
8 2 3 2 6 2 1 6 4 34 2953
7 1 1 3 2 1 4 8 27 2788
6 1 0 1 0 1 2 11 2037
5 0 0 1 1 0 7 1863
4 0 0 1 1 6 1231
3 0 1 1 5 823
2 0 1 3 638
1 0 1 568
Total 9 12 16 18 19 17 21 19 14 14 6 3


Result

The book first converted the data in the table above into the following format, as given in Table 11.4 in the book.

TTF (Months) Number of Failures Number of Censored Units
1 9 568
2 12 637
3 16 821
4 18 1229
5 19 1861
6 17 2032
7 21 2768
8 19 2927
9 14 3029
10 14 2203
11 6 1834
12 3 2090

A lognormal distribution is used and the fitted model parameters are: Ln-Mean = 6.03 and Ln-Std = 1.63.


Results in Weibull++

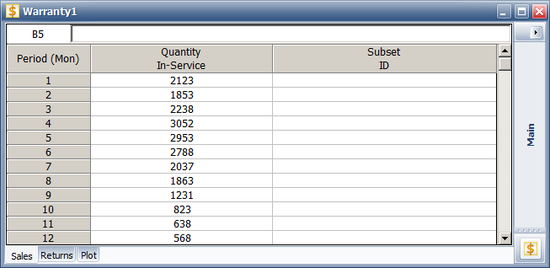
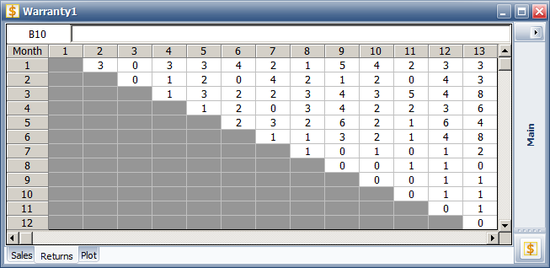
In Weibull++, the data set is entered into a warranty folio, using the Nevada chart format. The following pictures show the sales and returns data.

Warranty sales.png


Warranty returns.png


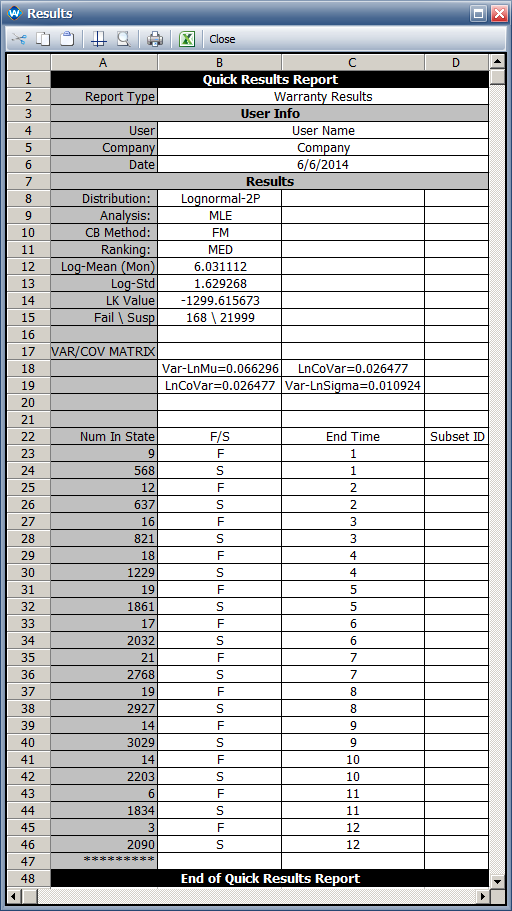
The following picture shows the parameters of the lognormal distribution and its associated failure/suspension data. The results are the same as the results shown in the book.

Warranty results.png


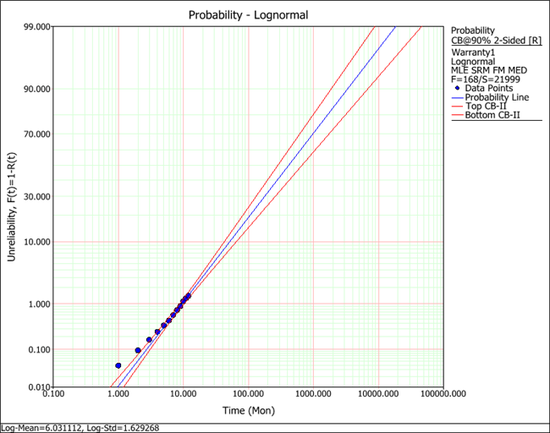
The following picture shows the probability plot of the lognormal distribution.


Warranty plot.png