Xfmea Risk Discovery Analysis Example: Difference between revisions
Chris Kahn (talk | contribs) No edit summary |
Chris Kahn (talk | contribs) No edit summary |
||
| Line 17: | Line 17: | ||
When the team uses the questions to discuss each subsystem, they determine that the highest risk assemblies are the printing system followed by the document management system. The copying and scanning systems are highly leveraged from previous designs and as a result they were graded lower in terms of risk. The assemblies that will receive subsystem level FMEAs will be marked by selecting the ''Mark item for more detailed analysis'' check box. This will give the team a clear path of where to focus their FMEA efforts first. | When the team uses the questions to discuss each subsystem, they determine that the highest risk assemblies are the printing system followed by the document management system. The copying and scanning systems are highly leveraged from previous designs and as a result they were graded lower in terms of risk. The assemblies that will receive subsystem level FMEAs will be marked by selecting the ''Mark item for more detailed analysis'' check box. This will give the team a clear path of where to focus their FMEA efforts first. | ||
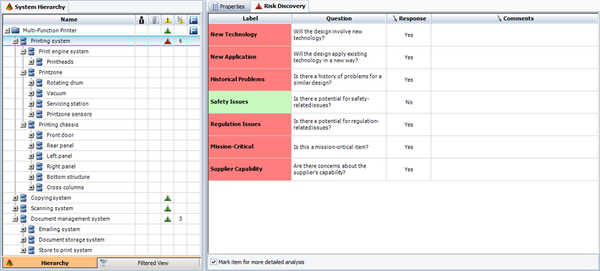
The next figure shows the analysis for the printing system. Notice that because the subsystem was marked for more detailed analysis, a red exclamation sign appears next to it in the Risk Discovery Analysis column of the System Hierarchy tab. | The next figure shows the analysis for the printing system. Notice that because the subsystem was marked for more detailed analysis, a red exclamation sign appears next to it in the Risk Discovery Analysis column of the System Hierarchy tab. The number 6 next to this sign indicates that 6 of the questions were answered with a "Yes", which provides an indication of the risk associated with this system (higher number = more risk). | ||
[[Image:Printer System for FMEA Example 1.png|center|600px|]] | [[Image:Printer System for FMEA Example 1.png|center|600px|]] | ||
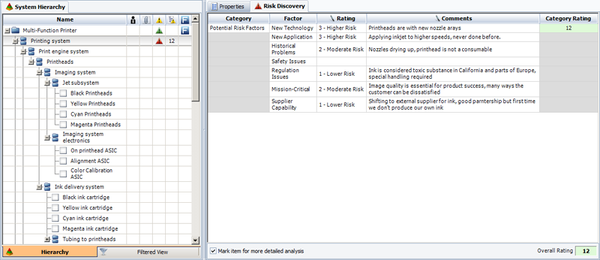
If the rating scales method were used instead, a risk rating scale would be assigned for each factor, as shown in the figure below. | If the rating scales method were used instead, a risk rating scale would be assigned for each factor, as shown in the figure below. In this case, the number 12 next to the red exclamation sign is the total of the ratings, which also provides an indication of the level of risk. | ||
[[Image:Printer System for FMEA Example 2.png|center|600px|]] | [[Image:Printer System for FMEA Example 2.png|center|600px|]] | ||
Revision as of 05:45, 17 August 2012
Let’s examine the new Risk Discovery analysis feature in Xfmea through a fictional example. Suppose that a technology company is developing a new complex product. It is a multi-function printer that prints, copies, scans and has several other features, such as scan to e-mail, document management, etc.
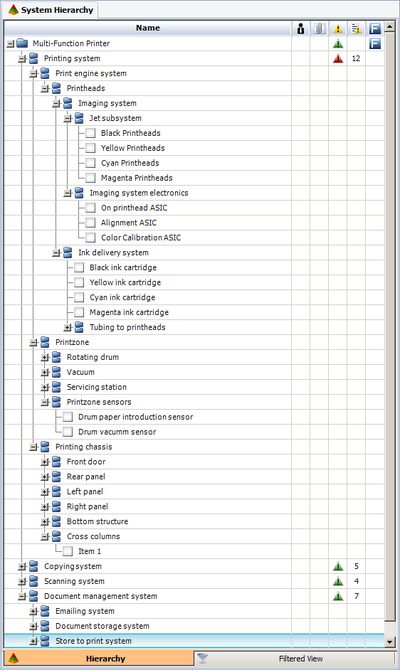
The figure below shows the system hierarchy, with some subsystems fully expanded down to the component level and others collapsed at the subsystem level.
As a best practice, the team first conducts an FMEA at the top (system) level in order to address any potential problems related to interactions and interfaces. Starting the analysis at lower levels has been proven to be a practice that can lead to omission of interactions between subsystems. In most complex systems, interactions will account for more than 50% of the total failure modes that the system will experience. In such cases, it is essential to start with a top-down approach.
Once the top (system) level FMEA has been completed, the next question that the FMEA team faces is which subsystems and components to focus on. This is where the Risk Discovery feature in Xfmea is used. The team adds a Risk Discovery analysis for each of the main subsystems of the product: the printing system, the copying system, the scanning system and the document management system. Xfmea supports two configurable methods for this type of analysis: a set of yes/no questions (where a yes answer indicates that the assembly/component poses a risk that warrants more detailed analysis) or a set of predefined rating scales (which can be used to calculate an overall rating for each assembly/component).
For this example, we will assume that the organization has selected to use the Questions tab with the sample questions that are shipped by default with the software. These questions address the issues that would typically be considered with a change point analysis approach (e.g., new technology, new application, historical problems and supplier capability), together with other relevant issues (e.g., safety, regulatory requirements and mission criticality).
When the team uses the questions to discuss each subsystem, they determine that the highest risk assemblies are the printing system followed by the document management system. The copying and scanning systems are highly leveraged from previous designs and as a result they were graded lower in terms of risk. The assemblies that will receive subsystem level FMEAs will be marked by selecting the Mark item for more detailed analysis check box. This will give the team a clear path of where to focus their FMEA efforts first.
The next figure shows the analysis for the printing system. Notice that because the subsystem was marked for more detailed analysis, a red exclamation sign appears next to it in the Risk Discovery Analysis column of the System Hierarchy tab. The number 6 next to this sign indicates that 6 of the questions were answered with a "Yes", which provides an indication of the risk associated with this system (higher number = more risk).
If the rating scales method were used instead, a risk rating scale would be assigned for each factor, as shown in the figure below. In this case, the number 12 next to the red exclamation sign is the total of the ratings, which also provides an indication of the level of risk.


