Mechanical Components Example: Difference between revisions
Chuck Smith (talk | contribs) |
Lisa Hacker (talk | contribs) No edit summary |
||
| (9 intermediate revisions by 4 users not shown) | |||
| Line 1: | Line 1: | ||
<noinclude>{{Banner ALTA Examples}}</noinclude> | |||
A mechanical component was put into an accelerated test with temperature as the | A mechanical component was put into an accelerated life test with temperature as the stress type. The objective is to fit the Arrhenius-Weibull model to the observed data and analyze the result of the test. The following times-to-failure data were observed. | ||
{| | {|border="1" align="center" style="border-collapse: collapse;" cellpadding="5" cellspacing="5" | ||
!343 K | !343 K | ||
!363 K | !363 K | ||
| Line 29: | Line 29: | ||
|} | |} | ||
The parameters of the Arrhenius-Weibull model were estimated using the ALTA standard folio. The results are: | |||
::<math>\begin{align} | |||
\beta =1.771460,\text{ }B=86.183591,\text{ }C=1170.423770. | |||
\end{align}</math> | |||
The estimate shows a small value for <math>\beta</math>. The following observations can then be made: | |||
:* Life is not accelerated with temperature, or | |||
:* The stress increments were not sufficient, or | |||
:* The stress values used in the test were well within the "specification limits" for the product (see discussion [[Introduction to Accelerated Life Testing#Stresses & Stress Levels|here]]). | |||
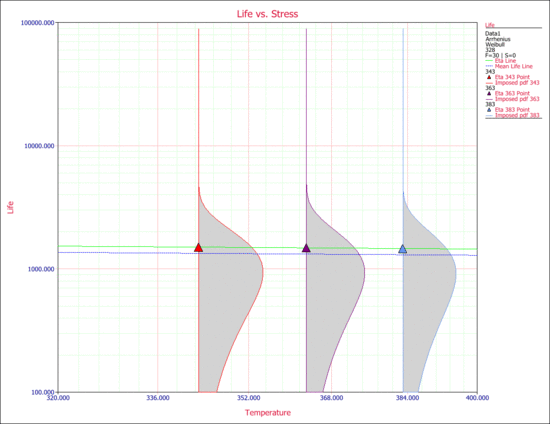
The value of <math>\beta</math> is not the only indicator for the observed behavior. As you can see from the data obtained from the test, the times-to-failure at all three stress levels fall within the same ranges. Another way to observe this is by looking at the Life vs. Stress plot. The following plot shows the scale parameter, <math>\eta </math>, and the mean life. As you can see, the life ( <math>\eta </math> and the mean life) are almost invariant with stress. | |||
< | [[Image:new_arrhexample.gif|center|550px|Eta and Mean Life vs. Stress.]] | ||
< | |||
[[Image:new_arrhexample.gif | |||
Latest revision as of 02:56, 16 August 2012
New format available! This reference is now available in a new format that offers faster page load, improved display for calculations and images and more targeted search.
As of January 2024, this Reliawiki page will not continue to be updated. Please update all links and bookmarks to the latest references at ALTA examples and ALTA reference examples.
A mechanical component was put into an accelerated life test with temperature as the stress type. The objective is to fit the Arrhenius-Weibull model to the observed data and analyze the result of the test. The following times-to-failure data were observed.
| 343 K | 363 K | 383 K |
|---|---|---|
| 266.66 | 618.54 | 351.12 |
| 430.09 | 666.72 | 355.1 |
| 570.45 | 724.4 | 672.69 |
| 890.42 | 950.89 | 923.35 |
| 1046.65 | 1148.4 | 948.22 |
| 1158.14 | 1202.94 | 1277.04 |
| 1396.01 | 1492.56 | 1538.81 |
| 1918.38 | 1619.59 | 2020.34 |
| 2028.86 | 2592.29 | 2099.03 |
| 2785.58 | 3596.85 | 2173.04 |
The parameters of the Arrhenius-Weibull model were estimated using the ALTA standard folio. The results are:
- [math]\displaystyle{ \begin{align} \beta =1.771460,\text{ }B=86.183591,\text{ }C=1170.423770. \end{align} }[/math]
The estimate shows a small value for [math]\displaystyle{ \beta }[/math]. The following observations can then be made:
- Life is not accelerated with temperature, or
- The stress increments were not sufficient, or
- The stress values used in the test were well within the "specification limits" for the product (see discussion here).
The value of [math]\displaystyle{ \beta }[/math] is not the only indicator for the observed behavior. As you can see from the data obtained from the test, the times-to-failure at all three stress levels fall within the same ranges. Another way to observe this is by looking at the Life vs. Stress plot. The following plot shows the scale parameter, [math]\displaystyle{ \eta }[/math], and the mean life. As you can see, the life ( [math]\displaystyle{ \eta }[/math] and the mean life) are almost invariant with stress.

