Electronic Devices Example: Difference between revisions
Nikki Helms (talk | contribs) |
|||
| Line 5: | Line 5: | ||
<br> | <br> | ||
<br> | <br> | ||
[[Image:11_2ex.png|center| | [[Image:11_2ex.png|center|350px|]] | ||
<br> | <br> | ||
Do the following: | Do the following: | ||
| Line 20: | Line 20: | ||
<br> | <br> | ||
[[Image:pv_ex2_1.gif|thumb|center| | [[Image:pv_ex2_1.gif|thumb|center|400px|]] | ||
<br> | <br> | ||
[[Image:pv_ex2_2.gif|thumb|center| | [[Image:pv_ex2_2.gif|thumb|center|400px|]] | ||
<br> | <br> | ||
<br> | <br> | ||
| Line 34: | Line 34: | ||
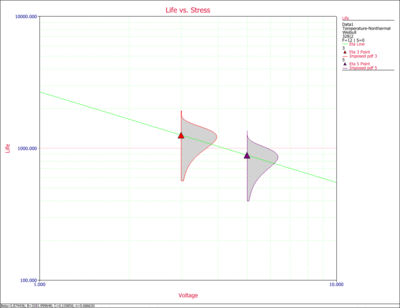
[[Image:ALTA14.6.gif|thumb|center| | [[Image:ALTA14.6.gif|thumb|center|400px|The effects of voltage on life, with temperature held constant at 328K.]] | ||
| Line 40: | Line 40: | ||
<br> | <br> | ||
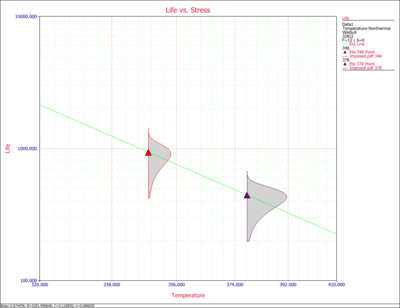
[[Image:ALTA14.7.gif|thumb|center| | [[Image:ALTA14.7.gif|thumb|center|400px|The effects of temperature on life, with voltage held constant at 2V.]] | ||
<br> | <br> | ||
<br> | <br> | ||
| Line 46: | Line 46: | ||
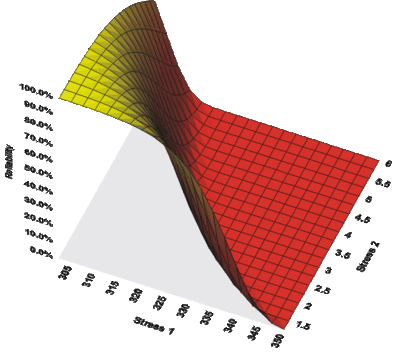
[[Image:ALTA14.8.gif|thumb|center| | [[Image:ALTA14.8.gif|thumb|center|400px|The combined effects of voltage and temperature on the reliability, as plotted in ALTA.]] | ||
<br> | <br> | ||
<br> | <br> | ||
Revision as of 17:35, 3 April 2012
Electronic Devices Example
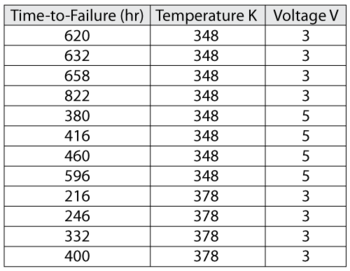
Twelve electronic devices were put into a continuous accelerated test. The accelerated stresses were temperature and voltage, with use level conditions of 328K and 2V respectively. The data set obtained is shown in the table below:
Do the following:
1) Using the T-NT Weibull model, analyze the data in ALTA and determine the MTTF and B(10) life for these devices at use level. Determine the upper and lower 90% 2-sided confidence intervals on the results.
2) Examine the effects of each stress on life.
Solution
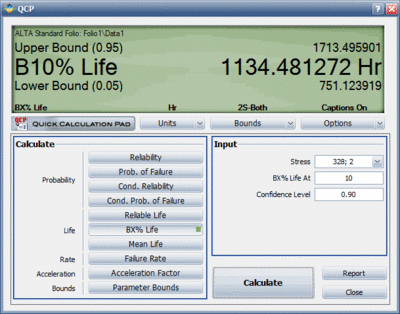
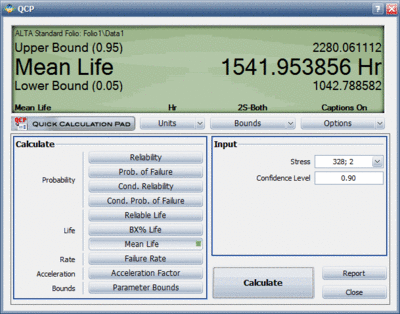
1. The data set was analyzed in ALTA and the following MTTF and [math]\displaystyle{ B(10) }[/math] life results were obtained: (The results are shown in ALTA's QCP in the following figures.)
2. The next two figures examine the effects of each stress on life.
Specifically, the next figure shows the Life vs. Voltage plot with temperature held constant at 328K.
The next figure shows the Life vs. Temperature plot with voltage held constant at 2V.
The next figure shows a 3D plot of reliability (at a constant time) versus both stresses. One can observe that reliability declines slightly faster with the change in temperature than with the change in voltage. Note that in the following plot, Stress 1 refers to temperature and Stress 2 refers to voltage.
