Target Reliability Tool Example: Difference between revisions
Nikki Helms (talk | contribs) No edit summary |
Lisa Hacker (talk | contribs) No edit summary |
||
| Line 1: | Line 1: | ||
'''Target Reliability-Determine Target Reliability Based on Costs''' | '''Target Reliability - Determine Target Reliability Based on Costs''' | ||
This example illustrates how to use the Target Reliability tool in Weibull++ to estimate the target reliability for a product based on financial considerations. | This example illustrates how to use the Target Reliability tool in Weibull++ to estimate the target reliability for a product based on financial considerations. | ||
| Line 5: | Line 5: | ||
With high product reliability, the initial production cost is expected to be high, and the cost due to failure is expected to be low. Moreover, a product with high reliability is expected to have a higher market share and higher unit sales price. A suitable reliability goal will be determined using these factors. | With high product reliability, the initial production cost is expected to be high, and the cost due to failure is expected to be low. Moreover, a product with high reliability is expected to have a higher market share and higher unit sales price. A suitable reliability goal will be determined using these factors. | ||
In this example, information on market share, sales prices, cost of production and costs due to failure are given in the following | In this example, information on market share, sales prices, cost of production and costs due to failure are given in the following figure. | ||
[[Image: Target Reliability Example Inputs.png|thumb|center|400px]] | [[Image: Target Reliability Example Inputs.png|thumb|center|400px]] | ||
The first row in the above table is the probability of failure during the warranty period. For example, in the best case, the expected probability of failure will be 1% (i.e., the reliability will be 99%). Under this reliability, the expected market share is 80%, average unit sale price is $2. | The first row in the above table is the probability of failure during the warranty period. For example, in the best case, the expected probability of failure will be 1% (i.e., the reliability will be 99%). Under this reliability, the expected market share is 80%, average unit sale price is $2.10, average cost per unit to produce is $1.50 and other costs per failure is $0.50. | ||
The assumed | The assumed maximum market potential is 1,000,000 and the initial investment is $10,000. | ||
'''Solution''' | '''Solution''' | ||
Based on the inputs, the cost models are estimated and the results are shown | Based on the inputs, the cost models are estimated and the results are shown below: | ||
[[Image: Target Reliability Example Model Results.png|thumb|center|400px]] | [[Image: Target Reliability Example Model Results.png|thumb|center|400px]] | ||
From these | From these models, the Cost vs. Reliability plot is: | ||
[[Image: Target Reliability Example Cost Plot.png|thumb|center|400px]] | [[Image: Target Reliability Example Cost Plot.png|thumb|center|400px]] | ||
The plot shows the best reliability value is 98.298%. | The plot shows that the best reliability value is 98.298%. | ||
The Profit vs. Reliability and R3OI vs. Reliability plots are also given | The Profit vs. Reliability and R3OI vs. Reliability plots are also given below. In the R3OI plot, the initial investment is set to $10,000. | ||
[[Image: Target Reliability Example Profit Plot.png|thumb|center|400px]] | [[Image: Target Reliability Example Profit Plot.png|thumb|center|400px]] | ||
[[Image: Target Reliability Example R3OI Plot.png|thumb|center|400px]] | [[Image: Target Reliability Example R3OI Plot.png|thumb|center|400px]] | ||
Revision as of 21:02, 30 March 2012
Target Reliability - Determine Target Reliability Based on Costs
This example illustrates how to use the Target Reliability tool in Weibull++ to estimate the target reliability for a product based on financial considerations.
With high product reliability, the initial production cost is expected to be high, and the cost due to failure is expected to be low. Moreover, a product with high reliability is expected to have a higher market share and higher unit sales price. A suitable reliability goal will be determined using these factors.
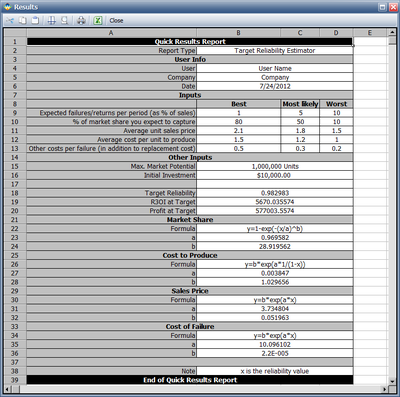
In this example, information on market share, sales prices, cost of production and costs due to failure are given in the following figure.
The first row in the above table is the probability of failure during the warranty period. For example, in the best case, the expected probability of failure will be 1% (i.e., the reliability will be 99%). Under this reliability, the expected market share is 80%, average unit sale price is $2.10, average cost per unit to produce is $1.50 and other costs per failure is $0.50.
The assumed maximum market potential is 1,000,000 and the initial investment is $10,000.
Solution
Based on the inputs, the cost models are estimated and the results are shown below:
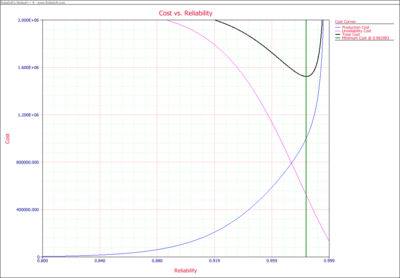
From these models, the Cost vs. Reliability plot is:
The plot shows that the best reliability value is 98.298%.
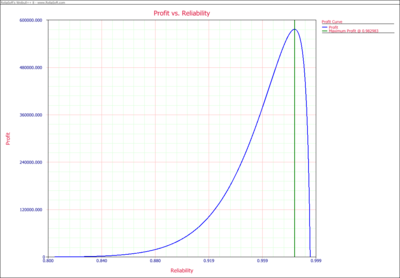
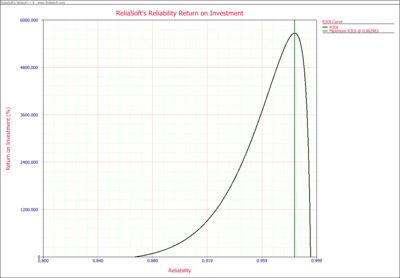
The Profit vs. Reliability and R3OI vs. Reliability plots are also given below. In the R3OI plot, the initial investment is set to $10,000.


