Template:Normal Distribution fisher matrix confidence bounds: Difference between revisions
(Created page with '===Fisher Matrix Confidence Bounds=== ====Bounds on the Parameters==== The lower and upper bounds on the mean, <math>\widehat{\mu }</math> , are estimated from: ::<math>\begin…') |
|
(No difference)
| |
Revision as of 17:38, 10 February 2012
Fisher Matrix Confidence Bounds
Bounds on the Parameters
The lower and upper bounds on the mean, [math]\displaystyle{ \widehat{\mu } }[/math] , are estimated from:
- [math]\displaystyle{ \begin{align} & {{\mu }_{U}}= & \widehat{\mu }+{{K}_{\alpha }}\sqrt{Var(\widehat{\mu })}\text{ (upper bound),} \\ & {{\mu }_{L}}= & \widehat{\mu }-{{K}_{\alpha }}\sqrt{Var(\widehat{\mu })}\text{ (lower bound)}\text{.} \end{align} }[/math]
Since the standard deviation, [math]\displaystyle{ {{\widehat{\sigma }}_{T}} }[/math] , must be positive, [math]\displaystyle{ \ln ({{\widehat{\sigma }}_{T}}) }[/math] is treated as normally distributed, and the bounds are estimated from:
- [math]\displaystyle{ \begin{align} & {{\sigma }_{U}}= & {{\widehat{\sigma }}_{T}}\cdot {{e}^{\tfrac{{{K}_{\alpha }}\sqrt{Var({{\widehat{\sigma }}_{T}})}}{{{\widehat{\sigma }}_{T}}}}}\text{ (upper bound),} \\ & {{\sigma }_{L}}= & \frac{{{\widehat{\sigma }}_{T}}}{{{e}^{\tfrac{{{K}_{\alpha }}\sqrt{Var({{\widehat{\sigma }}_{T}})}}{{{\widehat{\sigma }}_{T}}}}}}\text{ (lower bound),} \end{align} }[/math]
where [math]\displaystyle{ {{K}_{\alpha }} }[/math] is defined by:
- [math]\displaystyle{ \alpha =\frac{1}{\sqrt{2\pi }}\int_{{{K}_{\alpha }}}^{\infty }{{e}^{-\tfrac{{{t}^{2}}}{2}}}dt=1-\Phi ({{K}_{\alpha }}) }[/math]
If [math]\displaystyle{ \delta }[/math] is the confidence level, then [math]\displaystyle{ \alpha =\tfrac{1-\delta }{2} }[/math] for the two-sided bounds and [math]\displaystyle{ \alpha =1-\delta }[/math] for the one-sided bounds.
The variances and covariances of [math]\displaystyle{ \widehat{\mu } }[/math] and [math]\displaystyle{ {{\widehat{\sigma }}_{T}} }[/math] are estimated from the Fisher matrix, as follows:
- [math]\displaystyle{ \left( \begin{matrix} \widehat{Var}\left( \widehat{\mu } \right) & \widehat{Cov}\left( \widehat{\mu },{{\widehat{\sigma }}_{T}} \right) \\ \widehat{Cov}\left( \widehat{\mu },{{\widehat{\sigma }}_{T}} \right) & \widehat{Var}\left( {{\widehat{\sigma }}_{T}} \right) \\ \end{matrix} \right)=\left( \begin{matrix} -\tfrac{{{\partial }^{2}}\Lambda }{\partial {{\mu }^{2}}} & -\tfrac{{{\partial }^{2}}\Lambda }{\partial \mu \partial {{\sigma }_{T}}} \\ {} & {} \\ -\tfrac{{{\partial }^{2}}\Lambda }{\partial \mu \partial {{\sigma }_{T}}} & -\tfrac{{{\partial }^{2}}\Lambda }{\partial \sigma _{T}^{2}} \\ \end{matrix} \right)_{\mu =\widehat{\mu },\sigma =\widehat{\sigma }}^{-1} }[/math]
[math]\displaystyle{ \Lambda }[/math] is the log-likelihood function of the normal distribution, described in
Chapter 3 and Appendix C.
Bounds on Reliability
The reliability of the normal distribution is:
- [math]\displaystyle{ \widehat{R}(T;\hat{\mu },{{\hat{\sigma }}_{T}})=\int_{T}^{\infty }\frac{1}{{{\widehat{\sigma }}_{T}}\sqrt{2\pi }}{{e}^{-\tfrac{1}{2}{{\left( \tfrac{t-\widehat{\mu }}{{{\widehat{\sigma }}_{T}}} \right)}^{2}}}}dt }[/math]
Let [math]\displaystyle{ \widehat{z}(t;\hat{\mu },{{\hat{\sigma }}_{T}})=\tfrac{t-\widehat{\mu }}{{{\widehat{\sigma }}_{T}}}, }[/math] then [math]\displaystyle{ \tfrac{dz}{dt}=\tfrac{1}{{{\widehat{\sigma }}_{T}}}. }[/math] For [math]\displaystyle{ t=T }[/math] , [math]\displaystyle{ \widehat{z}=\tfrac{T-\widehat{\mu }}{{{\widehat{\sigma }}_{T}}} }[/math] , and for [math]\displaystyle{ t=\infty , }[/math] [math]\displaystyle{ \widehat{z}=\infty . }[/math] The above equation then becomes:
- [math]\displaystyle{ \hat{R}(\widehat{z})=\int_{\widehat{z}(T)}^{\infty }\frac{1}{\sqrt{2\pi }}{{e}^{-\tfrac{1}{2}{{z}^{2}}}}dz }[/math]
The bounds on [math]\displaystyle{ z }[/math] are estimated from:
- [math]\displaystyle{ \begin{align} & {{z}_{U}}= & \widehat{z}+{{K}_{\alpha }}\sqrt{Var(\widehat{z})} \\ & {{z}_{L}}= & \widehat{z}-{{K}_{\alpha }}\sqrt{Var(\widehat{z})} \end{align} }[/math]
- where:
- [math]\displaystyle{ Var(\widehat{z})={{\left( \frac{\partial z}{\partial \mu } \right)}^{2}}Var(\widehat{\mu })+{{\left( \frac{\partial z}{\partial {{\sigma }_{T}}} \right)}^{2}}Var({{\widehat{\sigma }}_{T}})+2\left( \frac{\partial z}{\partial \mu } \right)\left( \frac{\partial z}{\partial {{\sigma }_{T}}} \right)Cov\left( \widehat{\mu },{{\widehat{\sigma }}_{T}} \right) }[/math]
- or:
- [math]\displaystyle{ Var(\widehat{z})=\frac{1}{\widehat{\sigma }_{T}^{2}}\left[ Var(\widehat{\mu })+{{\widehat{z}}^{2}}Var({{\widehat{\sigma }}_{T}})+2\cdot \widehat{z}\cdot Cov\left( \widehat{\mu },{{\widehat{\sigma }}_{T}} \right) \right] }[/math]
The upper and lower bounds on reliability are:
- [math]\displaystyle{ \begin{align} & {{R}_{U}}= & \int_{{{z}_{L}}}^{\infty }\frac{1}{\sqrt{2\pi }}{{e}^{-\tfrac{1}{2}{{z}^{2}}}}dz\text{ (upper bound)} \\ & {{R}_{L}}= & \int_{{{z}_{U}}}^{\infty }\frac{1}{\sqrt{2\pi }}{{e}^{-\tfrac{1}{2}{{z}^{2}}}}dz\text{ (lower bound)} \end{align} }[/math]
Bounds on Time
The bounds around time for a given normal percentile (unreliability) are estimated by first solving the reliability equation with respect to time, as follows:
- [math]\displaystyle{ \hat{T}(\widehat{\mu },{{\widehat{\sigma }}_{T}})=\widehat{\mu }+z\cdot {{\widehat{\sigma }}_{T}} }[/math]
- where:
- [math]\displaystyle{ z={{\Phi }^{-1}}\left[ F(T) \right] }[/math]
- and:
- [math]\displaystyle{ \Phi (z)=\frac{1}{\sqrt{2\pi }}\int_{-\infty }^{z(T)}{{e}^{-\tfrac{1}{2}{{z}^{2}}}}dz }[/math]
The next step is to calculate the variance of [math]\displaystyle{ \hat{T}(\widehat{\mu },{{\widehat{\sigma }}_{T}}) }[/math] or:
- [math]\displaystyle{ \begin{align} Var(\hat{T})= & {{\left( \frac{\partial T}{\partial \mu } \right)}^{2}}Var(\widehat{\mu })+{{\left( \frac{\partial T}{\partial {{\sigma }_{T}}} \right)}^{2}}Var({{\widehat{\sigma }}_{T}}) \\ & +2\left( \frac{\partial T}{\partial \mu } \right)\left( \frac{\partial T}{\partial {{\sigma }_{T}}} \right)Cov\left( \widehat{\mu },{{\widehat{\sigma }}_{T}} \right) \\ Var(\hat{T})= & Var(\widehat{\mu })+{{\widehat{z}}^{2}}Var({{\widehat{\sigma }}_{T}})+2\cdot z\cdot Cov\left( \widehat{\mu },{{\widehat{\sigma }}_{T}} \right) \end{align} }[/math]
The upper and lower bounds are then found by:
- [math]\displaystyle{ \begin{align} & {{T}_{U}}= & \hat{T}+{{K}_{\alpha }}\sqrt{Var(\hat{T})}\text{ (upper bound)} \\ & {{T}_{L}}= & \hat{T}-{{K}_{\alpha }}\sqrt{Var(\hat{T})}\text{ (lower bound)} \end{align} }[/math]
Example 4
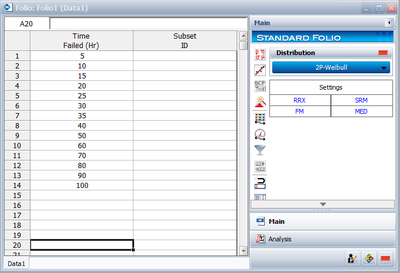
Using the data of Example 2 and assuming a normal distribution, estimate the parameters using the MLE method.
Solution to Example 4
In this example we have non-grouped data without suspensions and without interval data. The partial derivatives of the normal log-likelihood function, [math]\displaystyle{ \Lambda , }[/math] are given by:
- [math]\displaystyle{ \begin{align} \frac{\partial \Lambda }{\partial \mu }= & \frac{1}{{{\sigma }^{2}}}\underset{i=1}{\overset{14}{\mathop \sum }}\,({{T}_{i}}-\mu )=0 \\ \frac{\partial \Lambda }{\partial \sigma }= & \underset{i=1}{\overset{14}{\mathop \sum }}\,\left( \frac{{{T}_{i}}-\mu }{{{\sigma }^{3}}}-\frac{1}{\sigma } \right)=0 \end{align} }[/math]
(The derivations of these equations are presented in Appendix C.) Substituting the values of [math]\displaystyle{ {{T}_{i}} }[/math] and solving the above system simultaneously, we get [math]\displaystyle{ \widehat{\sigma }=29.58 }[/math] hours [math]\displaystyle{ , }[/math] [math]\displaystyle{ \widehat{\mu }=45 }[/math] hours [math]\displaystyle{ . }[/math]
The Fisher matrix is:
- [math]\displaystyle{ \left[ \begin{matrix} \widehat{Var}\left( \widehat{\mu } \right)=62.5000 & {} & \widehat{Cov}\left( \widehat{\mu },\widehat{\sigma } \right)=0.0000 \\ {} & {} & {} \\ \widehat{Cov}\left( \widehat{\mu },\widehat{\sigma } \right)=0.0000 & {} & \widehat{Var}\left( \widehat{\sigma } \right)=31.2500 \\ \end{matrix} \right] }[/math]
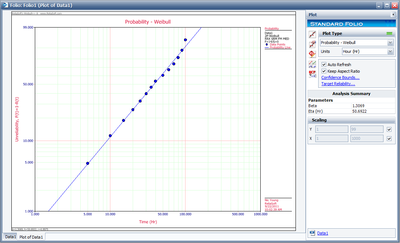
Using Weibull++ , the MLE method can be selected from the Set Analysis page.
The plot of the solution for this example is shown next.

