Weibull++ Weibull Degradation Plot ptDegradationLog: Difference between revisions
Jump to navigation
Jump to search
No edit summary |
No edit summary |
||
| Line 1: | Line 1: | ||
{{Template:NoSkin}} | {{Template:NoSkin}} | ||
{| | {| class="FCK__ShowTableBorders" border="0" cellspacing="0" cellpadding="0" align="center"; style="width:100%;" | ||
|- | |- | ||
| valign="middle" align="left" bgcolor=EEEEEE|[[Image:Webnotesbar.png|center|195px]] | |||
|} | |||
{| class="FCK__ShowTableBorders" border="0" cellspacing="1" cellpadding="1" | |||
|- | |- | ||
| | | valign="middle" |{{Font|Degradation Plot Degradation vs. Time (Log)|11|tahoma|bold|gray}} | ||
|- | |- | ||
| | | valign="middle" | {{Font|Weibull++|10|tahoma|bold|gray}} | ||
|- | |- | ||
| | | valign="middle" | | ||
{{weibull degradation vs time plot}} | {{weibull degradation vs time plot}} | ||
|- | |- | ||
| | | valign="middle" | [http://www.reliawiki.com/index.php/Weibull%2B%2B_Plots Weibull++ Plots] | ||
|} | |} | ||
Revision as of 16:39, 9 February 2012
| Degradation Plot Degradation vs. Time (Log) |
| Weibull++ |
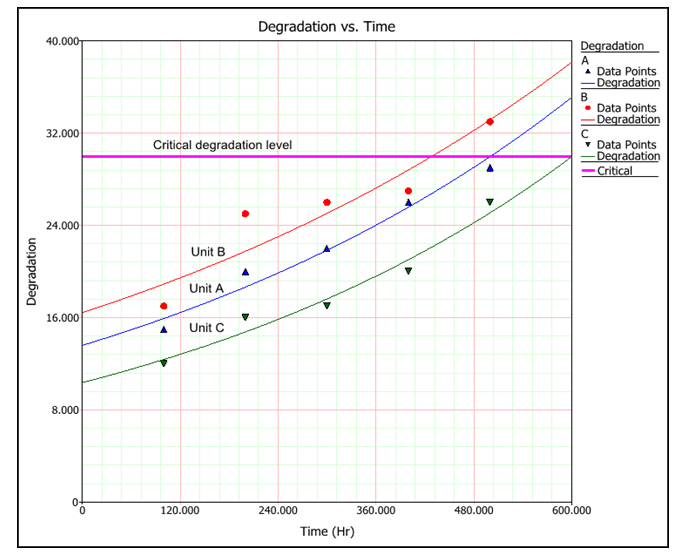
Degradation vs. TimeThe Degradation vs. Time plot shows how the performance of each unit ID degrades over time. You can select to plot the data points on a linear scale or on a logarithmic scale. The following example shows the linear scale plot. As you can see, unit B is expected to reach the critical degradation level first, compared to the other units. |
| Weibull++ Plots |

