Template:What are Confidence Bounds: Difference between revisions
| Line 22: | Line 22: | ||
We will now look at how this phenomenon relates to reliability. Overall, the reliability engineer's task is to determine the probability of failure, or reliability, of the population of units in question. However, one will never know the exact reliability value of the population unless one is able to obtain and analyze the failure data for every single unit in the population. Since this usually is not a realistic situation, the task then is to estimate the reliability based on a sample, much like estimating the number of black marbles in the pool. If we perform ten different reliability tests for our units, and analyze the results, we will obtain slightly different parameters for the distribution each time, and thus slightly different reliability results. However, by employing confidence bounds, we obtain a range within which these reliability values are likely to occur a certain percentage of the time. This helps us gauge the utility of the data and the accuracy of the resulting estimates. Plus, it is always useful to remember that each parameter is an estimate of the true parameter, one that is unknown to us. This range of plausible values is called a confidence interval. | We will now look at how this phenomenon relates to reliability. Overall, the reliability engineer's task is to determine the probability of failure, or reliability, of the population of units in question. However, one will never know the exact reliability value of the population unless one is able to obtain and analyze the failure data for every single unit in the population. Since this usually is not a realistic situation, the task then is to estimate the reliability based on a sample, much like estimating the number of black marbles in the pool. If we perform ten different reliability tests for our units, and analyze the results, we will obtain slightly different parameters for the distribution each time, and thus slightly different reliability results. However, by employing confidence bounds, we obtain a range within which these reliability values are likely to occur a certain percentage of the time. This helps us gauge the utility of the data and the accuracy of the resulting estimates. Plus, it is always useful to remember that each parameter is an estimate of the true parameter, one that is unknown to us. This range of plausible values is called a confidence interval. | ||
'''One-Sided and Two-Sided Confidence Bounds''' | |||
Confidence bounds are generally described as being one-sided or two-sided. | |||
Confidence bounds are generally described as being one-sided or two-sided. | |||
==== Two-Sided Bounds ==== | ==== Two-Sided Bounds ==== | ||
Revision as of 22:01, 8 February 2012
What are Confidence Bounds?
One of the most confusing concepts to a novice reliability engineer is estimating the precision of an estimate. This is an important concept in the field of reliability engineering, leading to the use of confidence intervals (or bounds). In this section, we will try to briefly present the concept in relatively simple terms but based on solid common sense.
The Black and White Marbles
To illustrate, consider the case where there are millions of perfectly mixed black and white marbles in a rather large swimming pool and our job is to estimate the percentage of black marbles. The only way to be absolutely certain about the exact percentage of marbles in the pool is to accurately count every last marble and calculate the percentage. However, this is too time- and resource-intensive to be a viable option, so we need to come up with a way of estimating the percentage of black marbles in the pool. In order to do this, we would take a relatively small sample of marbles from the pool and then count how many black marbles are in the sample.
Taking a Small Sample of Marbles
First, pick out a small sample of marbles and count the black ones. Say you picked out ten marbles and counted four black marbles. Based on this, your estimate would be that 40% of the marbles are black.
If you put the ten marbles back in the pool and repeat this example again, you might get six black marbles, changing your estimate to 60% black marbles. Which of the two is correct? Both estimates are correct! As you repeat this experiment over and over again, you might find out that this estimate is usually between [math]\displaystyle{ {{X}_{1}}% }[/math] and [math]\displaystyle{ {{X}_{2}}% }[/math], and you can assign a percentage to the number of times your estimate falls between these limits. For example, you notice that 90% of the time this estimate is between [math]\displaystyle{ {{X}_{1}}% }[/math] and [math]\displaystyle{ {{X}_{2}}%. }[/math]
Taking a Larger Sample of Marbles If you now repeat the experiment and pick out 1,000 marbles, you might get results for the number of black marbles such as 545, 570, 530, etc., for each trial. The range of the estimates in this case will be much narrower than before. For example, you observe that 90% of the time, the number of black marbles will now be from [math]\displaystyle{ {{Y}_{1}}% }[/math] to [math]\displaystyle{ {{Y}_{2}}% }[/math], where [math]\displaystyle{ {{X}_{1}}%\lt {{Y}_{1}}% }[/math] and [math]\displaystyle{ {{X}_{2}}%\gt {{Y}_{2}}% }[/math], thus giving you a more narrow estimate interval. The same principle is true for confidence intervals; the larger the sample size, the more narrow the confidence intervals.
Back to Reliability
We will now look at how this phenomenon relates to reliability. Overall, the reliability engineer's task is to determine the probability of failure, or reliability, of the population of units in question. However, one will never know the exact reliability value of the population unless one is able to obtain and analyze the failure data for every single unit in the population. Since this usually is not a realistic situation, the task then is to estimate the reliability based on a sample, much like estimating the number of black marbles in the pool. If we perform ten different reliability tests for our units, and analyze the results, we will obtain slightly different parameters for the distribution each time, and thus slightly different reliability results. However, by employing confidence bounds, we obtain a range within which these reliability values are likely to occur a certain percentage of the time. This helps us gauge the utility of the data and the accuracy of the resulting estimates. Plus, it is always useful to remember that each parameter is an estimate of the true parameter, one that is unknown to us. This range of plausible values is called a confidence interval.
One-Sided and Two-Sided Confidence Bounds Confidence bounds are generally described as being one-sided or two-sided.
Two-Sided Bounds
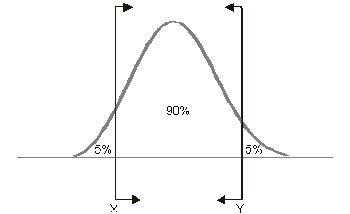
When we use two-sided confidence bounds (or intervals), we are looking at a closed interval where a certain percentage of the population is likely to lie. That is, we determine the values, or bounds, between which lies a specified percentage of the population. For example, when dealing with 90% two-sided confidence bounds of [math]\displaystyle{ (X,Y) }[/math], we are saying that 90% of the population lies between [math]\displaystyle{ X }[/math] and [math]\displaystyle{ Y }[/math] with 5% less than [math]\displaystyle{ X }[/math] and 5% greater than [math]\displaystyle{ Y }[/math].
One-Sided Bounds
One-sided confidence bounds are essentially an open-ended version of two-sided bounds. A one-sided bound defines the point where a certain percentage of the population is either higher or lower than the defined point. This means that there are two types of one-sided bounds: upper and lower. An upper one-sided bound defines a point that a certain percentage of the population is less than. Conversely, a lower one-sided bound defines a point that a specified percentage of the population is greater than.
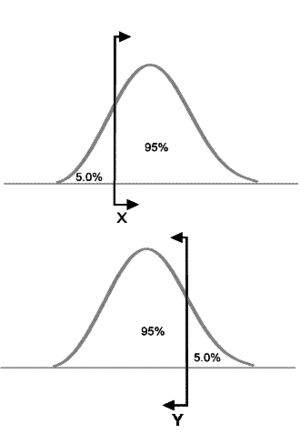
For example, if [math]\displaystyle{ X }[/math] is a 95% upper one-sided bound, this would imply that 95% of the population is less than [math]\displaystyle{ X }[/math]. If [math]\displaystyle{ X }[/math] is a 95% lower one-sided bound, this would indicate that 95% of the population is greater than [math]\displaystyle{ X }[/math]. Care must be taken to differentiate between one- and two-sided confidence bounds, as these bounds can take on identical values at different percentage levels. For example, in the figures above, we see bounds on a hypothetical distribution. Assuming this is the same distribution in all of the figures, we see that [math]\displaystyle{ X }[/math] marks the spot below which 5% of the distribution's population lies. Similarly, [math]\displaystyle{ Y }[/math] represents the point above which 5% of the population lies. Therefore, [math]\displaystyle{ X }[/math] and [math]\displaystyle{ Y }[/math] represent the 90% two-sided bounds, since 90% of the population lies between the two points. However, [math]\displaystyle{ X }[/math] also represents the lower one-sided 95% confidence bound, since 95% of the population lies above that point; and [math]\displaystyle{ Y }[/math] represents the upper one-sided 95% confidence bound, since 95% of the population is below [math]\displaystyle{ Y }[/math]. It is important to be sure of the type of bounds you are dealing with, particularly as both one-sided bounds can be displayed simultaneously in Weibull++. In Weibull++, we use upper to represent the higher limit and lower to represent the lower limit, regardless of their position, but based on the value of the results. So if obtaining the confidence bounds on the reliability, we would identify the lower value of reliability as the lower limit and the higher value of reliability as the higher limit. If obtaining the confidence bounds on probability of failure we will again identify the lower numeric value for the probability of failure as the lower limit and the higher value as the higher limit.


