Template:Example: Published 2P Weibull Distribution Complete Data RRY Example: Difference between revisions
No edit summary |
No edit summary |
||
| Line 9: | Line 9: | ||
Published Results (using Rank Regression on Y): | Published Results (using Rank Regression on Y): | ||
[[Image:example15formula.png | [[Image:example15formula.png]] | ||
'''Computed Results in Weibull++''' | '''Computed Results in Weibull++''' | ||
| Line 17: | Line 17: | ||
Weibull++ computed parameters for RRY are: | Weibull++ computed parameters for RRY are: | ||
[[Image:example15formula2.png | [[Image:example15formula2.png]] | ||
The small difference between the published results and the ones obtained from Weibull++ is due to the difference in the median rank values between the two (in the publication, median ranks are obtained from tables to 3 decimal places, whereas in Weibull++ they are calculated and carried out up to the 15th decimal point). | The small difference between the published results and the ones obtained from Weibull++ is due to the difference in the median rank values between the two (in the publication, median ranks are obtained from tables to 3 decimal places, whereas in Weibull++ they are calculated and carried out up to the 15th decimal point). | ||
You will also notice that in the examples that follow, a small difference may exist between the published results and the ones obtained from Weibull++. This can be attributed to the difference between the computer numerical precision employed by Weibull++ and the lower number of significant digits used by the original authors. In most of these publications, no information was given as to the numerical precision used. | You will also notice that in the examples that follow, a small difference may exist between the published results and the ones obtained from Weibull++. This can be attributed to the difference between the computer numerical precision employed by Weibull++ and the lower number of significant digits used by the original authors. In most of these publications, no information was given as to the numerical precision used. | ||
Revision as of 05:33, 6 August 2012
Published 2P Weibull Distribution Complete Data RRY Example
From Dimitri Kececioglu, Reliability & Life Testing Handbook, Page 418 [20].
Sample of 10 units, all tested to failure. The times-to-failure were recorded at 16; 34; 53; 75; 93; 120; 150; 191; 240; and 339 hours.
Published Results
Published Results (using Rank Regression on Y):
Computed Results in Weibull++
This same data set can be entered into Weibull++ by selecting the Times to Failure type. Use RRY for the estimation method.
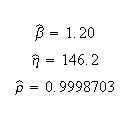
Weibull++ computed parameters for RRY are:
The small difference between the published results and the ones obtained from Weibull++ is due to the difference in the median rank values between the two (in the publication, median ranks are obtained from tables to 3 decimal places, whereas in Weibull++ they are calculated and carried out up to the 15th decimal point).
You will also notice that in the examples that follow, a small difference may exist between the published results and the ones obtained from Weibull++. This can be attributed to the difference between the computer numerical precision employed by Weibull++ and the lower number of significant digits used by the original authors. In most of these publications, no information was given as to the numerical precision used.

