Template:Example: Normal General Example Interval Data: Difference between revisions
Jump to navigation
Jump to search
Chris Kahn (talk | contribs) No edit summary |
No edit summary |
||
| Line 3: | Line 3: | ||
Eight units are being reliability tested and the following is a table of their times-to-failure: | Eight units are being reliability tested and the following is a table of their times-to-failure: | ||
{|border="1" align="center" style="border-collapse: collapse;" cellpadding="5" cellspacing="5" | |||
{|align="center" border= | |||
|- | |- | ||
|colspan="3" style="text-align:center"| | |colspan="3" style="text-align:center"| Non-Grouped Data Times-to-Failure with intervals (lnterval and left censored) | ||
|- | |- | ||
!Data point index | !Data point index | ||
| Line 33: | Line 32: | ||
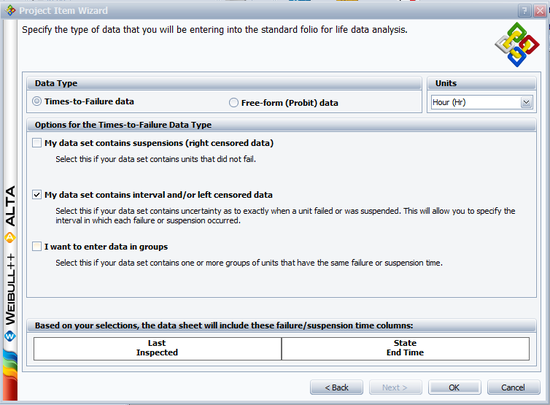
This is a sequence of interval times-to-failure. This data set can be entered into Weibull++ by creating a data sheet that can be used to analyze times-to-failure data with interval and left censored data. | This is a sequence of interval times-to-failure. This data set can be entered into Weibull++ by creating a data sheet that can be used to analyze times-to-failure data with interval and left censored data. | ||
[[Image:lastinspected.png|center|550px| ]] | |||
[[Image:lastinspected.png | |||
[[Image:lastinspectedsheet.png | [[Image:lastinspectedsheet.png|center|550px]] | ||
The computed parameters for maximum likelihood are: | The computed parameters for maximum likelihood are: | ||
| Line 58: | Line 57: | ||
& {{{\hat{\sigma }}}_{T}}= & 9.25. | & {{{\hat{\sigma }}}_{T}}= & 9.25. | ||
\end{align}</math> | \end{align}</math> | ||
A plot of the RRX solution is shown next. | A plot of the RRX solution is shown next. | ||
<math></math> | <math></math> | ||
[[Image:lastinspectedplot.png | [[Image:lastinspectedplot.png|center|550px| ]] | ||
Revision as of 02:55, 8 August 2012
Normal Distribution General Example Interval Data
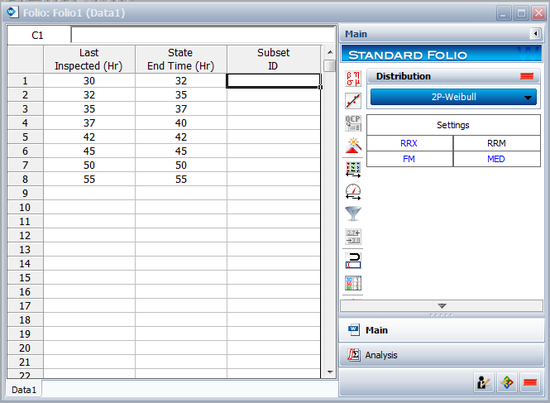
Eight units are being reliability tested and the following is a table of their times-to-failure:
| Non-Grouped Data Times-to-Failure with intervals (lnterval and left censored) | ||
| Data point index | Last Inspected | State End Time |
|---|---|---|
| 1 | 30 | 32 |
| 2 | 32 | 35 |
| 3 | 35 | 37 |
| 4 | 37 | 40 |
| 5 | 42 | 42 |
| 6 | 45 | 45 |
| 7 | 50 | 50 |
| 8 | 55 | 55 |
Solution
This is a sequence of interval times-to-failure. This data set can be entered into Weibull++ by creating a data sheet that can be used to analyze times-to-failure data with interval and left censored data.


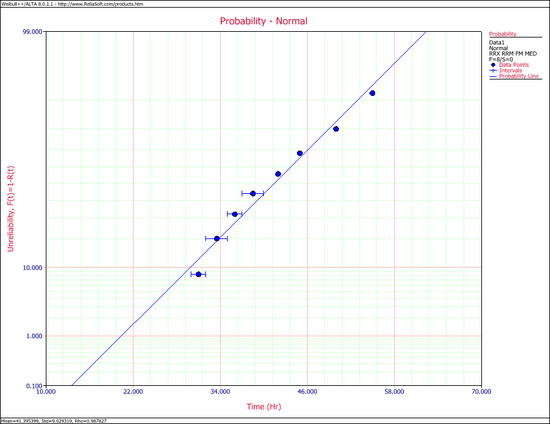
The computed parameters for maximum likelihood are:
- [math]\displaystyle{ \begin{align} & \widehat{\mu }= & 41.40 \\ & {{{\hat{\sigma }}}_{T}}= & 7.740. \end{align} }[/math]
For rank regression on x:
- [math]\displaystyle{ \begin{align} & \widehat{\mu }= & 41.40 \\ & {{{\hat{\sigma }}}_{T}}= & 9.03. \end{align} }[/math]
For rank regression on y:
- [math]\displaystyle{ \begin{align} & \widehat{\mu }= & 41.39 \\ & {{{\hat{\sigma }}}_{T}}= & 9.25. \end{align} }[/math]
A plot of the RRX solution is shown next.
[math]\displaystyle{ }[/math]
