Template:Example: Normal General Example (RRX Report): Difference between revisions
No edit summary |
Chris Kahn (talk | contribs) No edit summary |
||
| Line 13: | Line 13: | ||
Type Time in cell A1 and Failure Rate in cell B1. Then enter 1000 through 10000 in cells A2 to A11. Finally, place the cursor into cell B2, as shown next. | Type Time in cell A1 and Failure Rate in cell B1. Then enter 1000 through 10000 in cells A2 to A11. Finally, place the cursor into cell B2, as shown next. | ||
[[Image:plainspreadsheet.png|thumb|center| | [[Image:plainspreadsheet.png|thumb|center|500px| ]] | ||
Open the Function Wizard by selecting Function Wizard from the Data menu or by clicking the Function Wizard icon. | Open the Function Wizard by selecting Function Wizard from the Data menu or by clicking the Function Wizard icon. | ||
| Line 21: | Line 21: | ||
Select FAILURERATE from the list of functions. Enter A2 for Time; this indicates that the time input for the equation will be obtained from the specified cell in the worksheet. To specify the existing Weibull++ analysis that the function result will be based on, click Select... to open the Select Folio/Data Sheet window and then navigate to the desired sheet. | Select FAILURERATE from the list of functions. Enter A2 for Time; this indicates that the time input for the equation will be obtained from the specified cell in the worksheet. To specify the existing Weibull++ analysis that the function result will be based on, click Select... to open the Select Folio/Data Sheet window and then navigate to the desired sheet. | ||
[[Image:A2functionwizard.png|thumb|center| | [[Image:A2functionwizard.png|thumb|center|500px]] | ||
[[Image:A2selectdatasheet.png|thumb|center| | [[Image:A2selectdatasheet.png|thumb|center|500px]] | ||
Click OK to close the window and return to the Function Wizard. Click Add to Equation to update the box at the bottom of the window with the function code that will be inserted into the spreadsheet. | Click OK to close the window and return to the Function Wizard. Click Add to Equation to update the box at the bottom of the window with the function code that will be inserted into the spreadsheet. | ||
[[Image:functionwizardFR.png|thumb|center| | [[Image:functionwizardFR.png|thumb|center|500px]] | ||
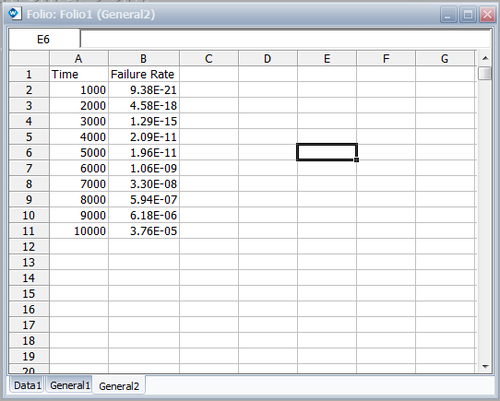
Click Insert to close the window and insert the function code into the active cell in the General Spreadsheet. Copy the function into cells B3 through B11. One way to do this is to position the mouse over the bottom right corner of cell B2 and when the cursor turns into a plus symbol (+), click and drag the mouse to cell B11. By selecting one of the cells that you copied the function into, you can see that the cell reference was updated to match the current row, as shown next with cell B11 selected. The results are as follows: | Click Insert to close the window and insert the function code into the active cell in the General Spreadsheet. Copy the function into cells B3 through B11. One way to do this is to position the mouse over the bottom right corner of cell B2 and when the cursor turns into a plus symbol (+), click and drag the mouse to cell B11. By selecting one of the cells that you copied the function into, you can see that the cell reference was updated to match the current row, as shown next with cell B11 selected. The results are as follows: | ||
[[Image:folio^E.png|thumb|center| | [[Image:folio^E.png|thumb|center|500px]] | ||
Revision as of 18:54, 21 May 2012
Normal Distribution General Example (RRX Report)
Using the data from Example 8, and using the rank regression on X analysis method (RRX), obtain tabulated values for the failure rate for 10 different mission end times. The mission end times are 1,000 to 10,000 hours, using increments of 1,000 hours.
Solution
This can be easily accomplished via the use of the Function Wizard, available in either Weibull++'s Reports or the General Spreadsheet. (For more information on these features, please refer to the Weibull++ User's Guide.) We will illustrate this using the General Spreadsheet.
First, click on Insert General Spread Sheet from the Folio menu.
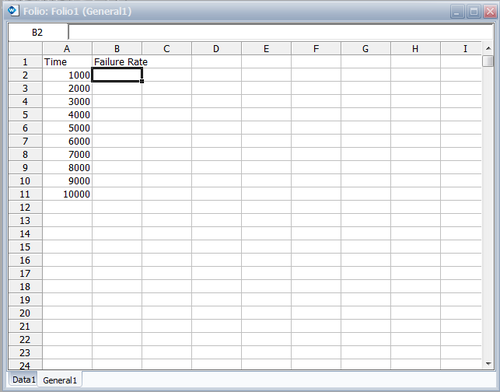
Type Time in cell A1 and Failure Rate in cell B1. Then enter 1000 through 10000 in cells A2 to A11. Finally, place the cursor into cell B2, as shown next.
Open the Function Wizard by selecting Function Wizard from the Data menu or by clicking the Function Wizard icon.
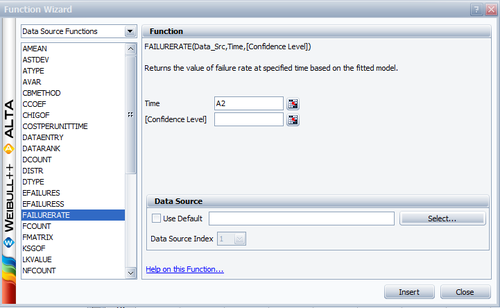
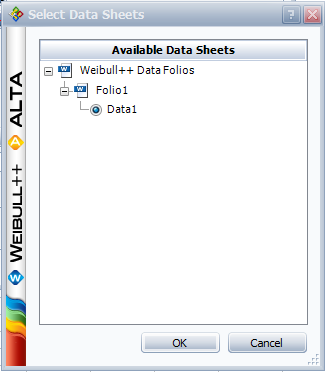
Select FAILURERATE from the list of functions. Enter A2 for Time; this indicates that the time input for the equation will be obtained from the specified cell in the worksheet. To specify the existing Weibull++ analysis that the function result will be based on, click Select... to open the Select Folio/Data Sheet window and then navigate to the desired sheet.
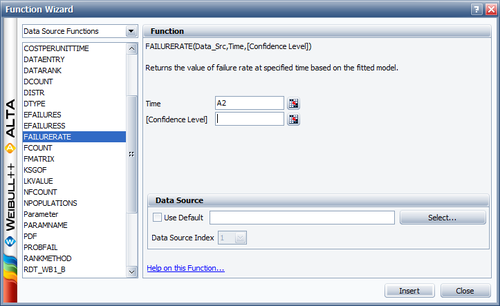
Click OK to close the window and return to the Function Wizard. Click Add to Equation to update the box at the bottom of the window with the function code that will be inserted into the spreadsheet.
Click Insert to close the window and insert the function code into the active cell in the General Spreadsheet. Copy the function into cells B3 through B11. One way to do this is to position the mouse over the bottom right corner of cell B2 and when the cursor turns into a plus symbol (+), click and drag the mouse to cell B11. By selecting one of the cells that you copied the function into, you can see that the cell reference was updated to match the current row, as shown next with cell B11 selected. The results are as follows:
