Template:Example:2Subpop Mixed Weibull: Difference between revisions
Lisa Hacker (talk | contribs) No edit summary |
Lisa Hacker (talk | contribs) No edit summary |
||
| Line 3: | Line 3: | ||
We will illustrate mixed Weibull analysis using a Monte Carlo generated set of data. To repeat this example, generate data from a two-parameter Weibull distribution, using the Weibull++ Monte Carlo data window. The following figures illustrate the required steps, inputs and results. | We will illustrate mixed Weibull analysis using a Monte Carlo generated set of data. To repeat this example, generate data from a two-parameter Weibull distribution, using the Weibull++ Monte Carlo data window. The following figures illustrate the required steps, inputs and results. | ||
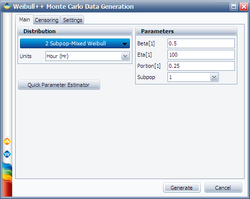
In the Monte Carlo window, enter the values and select the options shown below for subpopulation 1. | |||
[[Image:Mixed Weibull Example 1 Simulation Sub1.png|thumb|center|250px| ]] | [[Image:Mixed Weibull Example 1 Simulation Sub1.png|thumb|center|250px| ]] | ||
| Line 15: | Line 15: | ||
[[Image:Mixed Weibull Example 1 Simulation Settings.png|thumb|center|250px| ]] | [[Image:Mixed Weibull Example 1 Simulation Settings.png|thumb|center|250px| ]] | ||
After the data set has been generated, choose the 2 Subpop-Mixed Weibull distribution. Click | After the data set has been generated, choose the 2 Subpop-Mixed Weibull distribution. Click '''Calculate'''. | ||
The results for subpopulation 1 are shown next. (Note that your results could be different due to the randomness of the simulation.) | The results for subpopulation 1 are shown next. (Note that your results could be different due to the randomness of the simulation.) | ||
Revision as of 16:57, 19 July 2012
A Mixed Weibull Example (2Subpop)
We will illustrate mixed Weibull analysis using a Monte Carlo generated set of data. To repeat this example, generate data from a two-parameter Weibull distribution, using the Weibull++ Monte Carlo data window. The following figures illustrate the required steps, inputs and results.
In the Monte Carlo window, enter the values and select the options shown below for subpopulation 1.
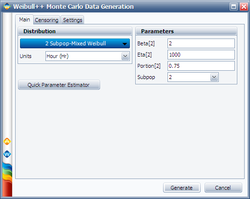
Switch to subpopulation 2 and make the selection shown below. Click Generate.
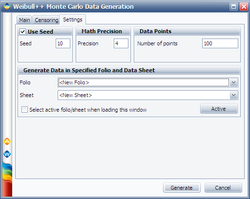
The simulation settings are:
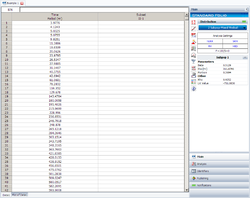
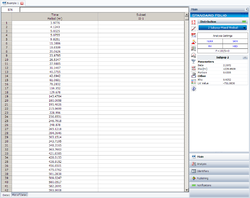
After the data set has been generated, choose the 2 Subpop-Mixed Weibull distribution. Click Calculate.
The results for subpopulation 1 are shown next. (Note that your results could be different due to the randomness of the simulation.)
The results for subpopulation 2 are shown next (Note that your results could be different due to the randomness of the simulation.)
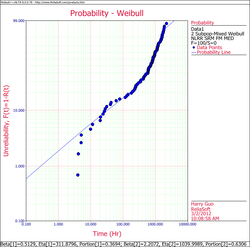
The Weibull probability plot for this data is shown next (Note that your results could be different due to the randomness of the simulation.)
