Temperature-Nonthermal Relationship Example
New format available! This reference is now available in a new format that offers faster page load, improved display for calculations and images and more targeted search.
As of January 2024, this Reliawiki page will not continue to be updated. Please update all links and bookmarks to the latest references at ALTA examples and ALTA reference examples.
This example appears in the Accelerated life testing reference.
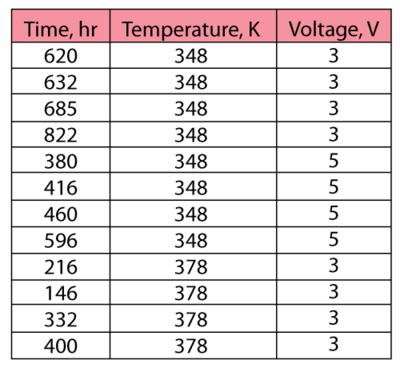
12 electronic devices were put into a continuous accelerated life test and the following data were collected.
Using ALTA and the T-NT lognormal model, the following parameters were obtained:
- [math]\displaystyle{ \begin{align} \widehat{Std}=\ & 0.182558 \\ \widehat{B}=\ & 3729.650303 \\ \widehat{C}=\ & 0.035292 \\ \widehat{n}=\ & 0.776797 \end{align}\,\! }[/math]
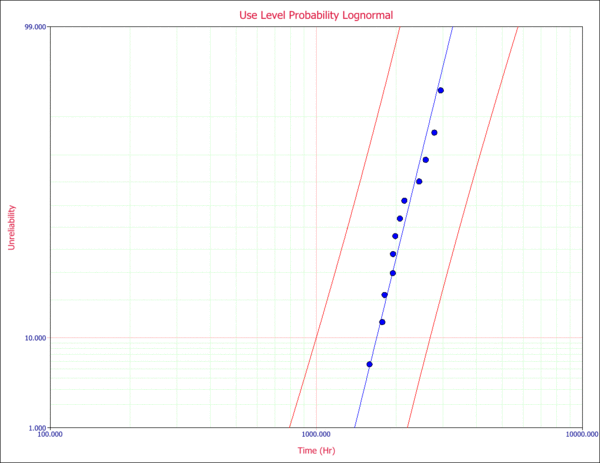
A probability plot, with the 2-sided 90% confidence bounds for the use stress levels of 323K and 2V, is shown next.
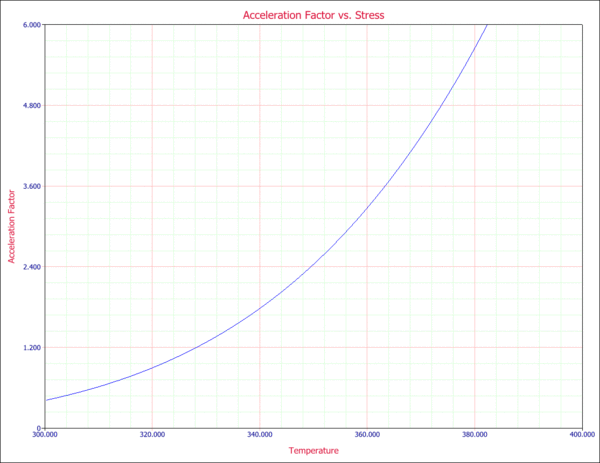
An acceleration factor plot, in which one of the stresses must be kept constant, can also be obtained. For example, in the following plot, the acceleration factor is plotted versus temperature given a constant voltage of 2V.


