T-H Example: Difference between revisions
Jump to navigation
Jump to search
Nikki Helms (talk | contribs) (Created page with '{| class="FCK__ShowTableBorders" border="0" cellspacing="0" cellpadding="0" align="center"; style="width:100%;" |- | valign="middle" align="left" bgcolor=EEEDF7|[[Image: ALTA-Exa…') |
Chris Kahn (talk | contribs) No edit summary |
||
| Line 1: | Line 1: | ||
{| class="FCK__ShowTableBorders" border="0" cellspacing="0" cellpadding="0" align="center"; style="width:100%;" | {| class="FCK__ShowTableBorders" border="0" cellspacing="0" cellpadding="0" align="center"; style="width:100%;" | ||
|- | |- | ||
| valign="middle" align="left" bgcolor=EEEDF7|[[Image: | | valign="middle" align="left" bgcolor=EEEDF7|[[Image: ALTA_Examples_Banner.png|400px|center]] | ||
|} | |} | ||
<br> | <br> | ||
Revision as of 09:24, 27 July 2012
 |
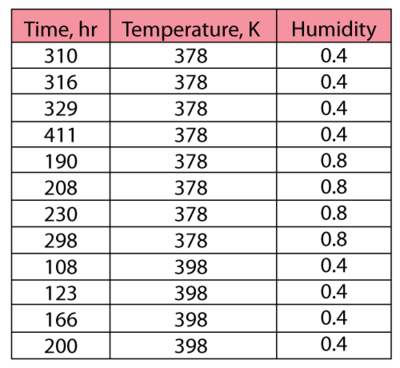
The following data were collected after testing twelve electronic devices at different temperature and humidity conditions:

Using ALTA, the following results were obtained:
- [math]\displaystyle{ \begin{align} \widehat{\beta }=\ & 5.874395 \\ & & \\ \widehat{A}=\ & 0.000060 \\ & & \\ \widehat{b}=\ & 0.280599 \\ & & \\ \widehat{\phi}=\ & 5630.329851 \end{align} }[/math]
A probability plot for the entered data is shown next.

Note that three lines are plotted because there are three combinations of stresses, namely, (398K, 0.4), (378K, 0.8) and (378K, 0.4).
Given the use stress levels, time estimates can be obtained for specified probability. A Life vs. Stress plot can be obtained if one of the stresses is kept constant. For example, the following picture is a Life vs. Temperature plot at a constant humidity of 0.4.
