Optimum Overhaul Example: Difference between revisions
Kate Racaza (talk | contribs) No edit summary |
Lisa Hacker (talk | contribs) No edit summary |
||
| (5 intermediate revisions by 2 users not shown) | |||
| Line 1: | Line 1: | ||
<noinclude>{{Banner RGA Examples}} | <noinclude>{{Banner RGA Examples}} | ||
''This example appears in the [ | ''This example appears in the [https://help.reliasoft.com/reference/reliability_growth_and_repairable_system_analysis Reliability growth reference]''. | ||
</noinclude> | </noinclude> | ||
Field data have been collected for a system that begins its wearout phase at time zero. The start time for each system is equal to zero and the end time for each system is 10,000 miles. Each system is scheduled to undergo an overhaul after a certain number of miles. It has been determined that the cost of an overhaul is four times more expensive than a repair. The table below presents the data. Do the following: | Field data have been collected for a system that begins its wearout phase at time zero. The start time for each system is equal to zero and the end time for each system is 10,000 miles. Each system is scheduled to undergo an overhaul after a certain number of miles. It has been determined that the cost of an overhaul is four times more expensive than a repair. The table below presents the data. Do the following: | ||
#Estimate the parameters of the Power Law model. | |||
#Determine the optimum overhaul interval. | |||
#If <math>\beta <1\,\!</math>, would it be cost-effective to implement an overhaul policy? | |||
{|border="1" align="center" style="border-collapse: collapse;" cellpadding="5" cellspacing="5" | {|border="1" align="center" style="border-collapse: collapse;" cellpadding="5" cellspacing="5" | ||
|- | |- | ||
|colspan="3" style="text-align:center"|'''Field | |colspan="3" style="text-align:center"|'''Field Data''' | ||
|- | |- | ||
!System 1 | !System 1 | ||
| Line 61: | Line 61: | ||
'''Solution''' | '''Solution''' | ||
<ol> | |||
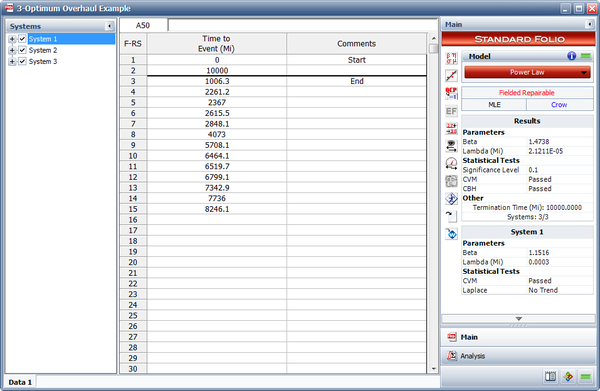
<li>The next figure shows the estimated Power Law parameters. | |||
[[Image:rga13.12.png | [[Image:rga13.12.png|center|600px]] | ||
</li> | |||
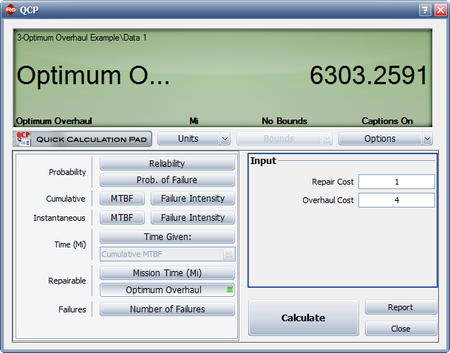
<li>The QCP can be used to calculate the optimum overhaul interval, as shown next. | |||
[[Image:rga13.13.png | [[Image:rga13.13.png|center|450px]] | ||
</li> | |||
<li>Since <math>\beta >1\,\!</math> the systems are wearing out and it would be cost-effective to implement an overhaul policy. An overhaul policy makes sense only if the systems are wearing out. | |||
</li> | |||
</ol> | |||
Latest revision as of 20:54, 18 September 2023
 |
New format available! This reference is now available in a new format that offers faster page load, improved display for calculations and images and more targeted search.
As of January 2024, this Reliawiki page will not continue to be updated. Please update all links and bookmarks to the latest references at RGA examples and RGA reference examples.
This example appears in the Reliability growth reference.
Field data have been collected for a system that begins its wearout phase at time zero. The start time for each system is equal to zero and the end time for each system is 10,000 miles. Each system is scheduled to undergo an overhaul after a certain number of miles. It has been determined that the cost of an overhaul is four times more expensive than a repair. The table below presents the data. Do the following:
- Estimate the parameters of the Power Law model.
- Determine the optimum overhaul interval.
- If [math]\displaystyle{ \beta \lt 1\,\! }[/math], would it be cost-effective to implement an overhaul policy?
| Field Data | ||
| System 1 | System 2 | System 3 |
|---|---|---|
| 1006.3 | 722.7 | 619.1 |
| 2261.2 | 1950.9 | 1519.1 |
| 2367 | 3259.6 | 2956.6 |
| 2615.5 | 4733.9 | 3114.8 |
| 2848.1 | 5105.1 | 3657.9 |
| 4073 | 5624.1 | 4268.9 |
| 5708.1 | 5806.3 | 6690.2 |
| 6464.1 | 5855.6 | 6803.1 |
| 6519.7 | 6325.2 | 7323.9 |
| 6799.1 | 6999.4 | 7501.4 |
| 7342.9 | 7084.4 | 7641.2 |
| 7736 | 7105.9 | 7851.6 |
| 8246.1 | 7290.9 | 8147.6 |
| 7614.2 | 8221.9 | |
| 8332.1 | 9560.5 | |
| 8368.5 | 9575.4 | |
| 8947.9 | ||
| 9012.3 | ||
| 9135.9 | ||
| 9147.5 | ||
| 9601 | ||
Solution
- The next figure shows the estimated Power Law parameters.
- The QCP can be used to calculate the optimum overhaul interval, as shown next.
- Since [math]\displaystyle{ \beta \gt 1\,\! }[/math] the systems are wearing out and it would be cost-effective to implement an overhaul policy. An overhaul policy makes sense only if the systems are wearing out.

