Non-Parametric Bayesian - Subsystem Tests: Difference between revisions
Lisa Hacker (talk | contribs) (Created page with '<noinclude>{{Banner Weibull Examples}} ''This example appears in the Life Data Analysis Reference book''. </noinclude> '''Example: Non-Parametric Bay…') |
Lisa Hacker (talk | contribs) No edit summary |
||
| (5 intermediate revisions by 3 users not shown) | |||
| Line 1: | Line 1: | ||
<noinclude>{{Banner Weibull Examples}} | <noinclude>{{Banner Weibull Examples}} | ||
''This example appears in the [ | ''This example appears in the [https://help.reliasoft.com/reference/life_data_analysis Life data analysis reference]''. | ||
</noinclude> | </noinclude> | ||
You can use the non-parametric Bayesian method to design a test for a system using information from tests on its subsystems. For example, suppose a system of interest is composed of three subsystems A, B and C -- with prior information from tests of these subsystems given in the table below. | |||
<center> | <center> | ||
{| border="1" align="center" style="border-collapse: collapse;" cellpadding="5" cellspacing="5" | {| border="1" align="center" style="border-collapse: collapse;" cellpadding="5" cellspacing="5" | ||
| Line 30: | Line 28: | ||
::<math> | ::<math> | ||
E\left(R_{i}\right)=\frac{n_{i}-r_{i}}{n_{i}+1} | E\left(R_{i}\right)=\frac{n_{i}-r_{i}}{n_{i}+1} | ||
</math> | \,\!</math> | ||
:<math> | ::<math> | ||
Var\left(R_{i}\right)=\frac{\left(n_{i}-r_{i}\right)\left(r_{i}+1\right)}{\left(n_{i}+1\right)^{2}\left(n_{i}+2\right)} | Var\left(R_{i}\right)=\frac{\left(n_{i}-r_{i}\right)\left(r_{i}+1\right)}{\left(n_{i}+1\right)^{2}\left(n_{i}+2\right)} | ||
</math> | \,\!</math> | ||
The results of these calculations are given in the table below. | The results of these calculations are given in the table below. | ||
| Line 59: | Line 57: | ||
These values can then be used to find the prior system reliability and its variance: | These values can then be used to find the prior system reliability and its variance: | ||
::<math>E\left(R_{0}\right)=0.846831227</math> | ::<math>E\left(R_{0}\right)=0.846831227\,\!</math> | ||
::<math>\text{Var}\left(R_{0}\right)=0.003546663</math> | ::<math>\text{Var}\left(R_{0}\right)=0.003546663\,\!</math> | ||
From the above two values, the parameters of the prior distribution of the system reliability can be calculated by: | From the above two values, the parameters of the prior distribution of the system reliability can be calculated by: | ||
::<math>\alpha_{0}=E\left(R_{0}\right)\left[\frac{E\left(R_{0}\right)-E^{2}\left(R_{0}\right)}{\text{Var}\left(R_{0}\right)}-1\right]=30.12337003</math> | ::<math>\alpha_{0}=E\left(R_{0}\right)\left[\frac{E\left(R_{0}\right)-E^{2}\left(R_{0}\right)}{\text{Var}\left(R_{0}\right)}-1\right]=30.12337003\,\!</math> | ||
::<math>\beta_{0}=\left(1-E \left(R_{0}\right)\right)\left[\frac{E\left(R_{0}\right)-E^{2}\left(R_{0}\right)}{Var \left(R_{0}\right)}-1\right]=5.448499634</math> | ::<math>\beta_{0}=\left(1-E \left(R_{0}\right)\right)\left[\frac{E\left(R_{0}\right)-E^{2}\left(R_{0}\right)}{Var \left(R_{0}\right)}-1\right]=5.448499634\,\!</math> | ||
With this prior distribution, we now can design a system reliability demonstration test by calculating system reliability ''R'', confidence level ''CL'', number of units ''n'' or number of failures ''r'', as needed. | With this prior distribution, we now can design a system reliability demonstration test by calculating system reliability ''R'', confidence level ''CL'', number of units ''n'' or number of failures ''r'', as needed. | ||
| Line 75: | Line 73: | ||
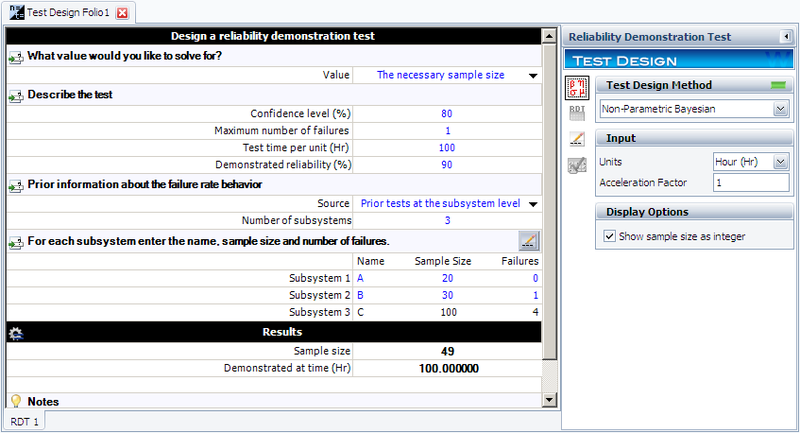
Using Weibull++, the results are given in the figure below. The result shows that at least 49 test units are needed. | Using Weibull++, the results are given in the figure below. The result shows that at least 49 test units are needed. | ||
[[Image: Bayesian_Test_Subsystem_Piror_Solve_for_n.png|center| | [[Image: Bayesian_Test_Subsystem_Piror_Solve_for_n.png|center|800px]] | ||
Latest revision as of 18:55, 18 September 2023
New format available! This reference is now available in a new format that offers faster page load, improved display for calculations and images and more targeted search.
As of January 2024, this Reliawiki page will not continue to be updated. Please update all links and bookmarks to the latest references at Weibull examples and Weibull reference examples.
This example appears in the Life data analysis reference.
You can use the non-parametric Bayesian method to design a test for a system using information from tests on its subsystems. For example, suppose a system of interest is composed of three subsystems A, B and C -- with prior information from tests of these subsystems given in the table below.
| Subsystem | Number of Units (n) | Number of Failures (r) |
|---|---|---|
| A | 20 | 0 |
| B | 30 | 1 |
| C | 100 | 4 |
This data can be used to calculate the expected value and variance of the reliability for each subsystem.
- [math]\displaystyle{ E\left(R_{i}\right)=\frac{n_{i}-r_{i}}{n_{i}+1} \,\! }[/math]
- [math]\displaystyle{ Var\left(R_{i}\right)=\frac{\left(n_{i}-r_{i}\right)\left(r_{i}+1\right)}{\left(n_{i}+1\right)^{2}\left(n_{i}+2\right)} \,\! }[/math]
The results of these calculations are given in the table below.
| Subsystem | Mean of Reliability | Variance of Reliability |
|---|---|---|
| A | 0.952380952 | 0.002061 |
| B | 0.935483871 | 0.001886 |
| C | 0.95049505 | 0.000461 |
These values can then be used to find the prior system reliability and its variance:
- [math]\displaystyle{ E\left(R_{0}\right)=0.846831227\,\! }[/math]
- [math]\displaystyle{ \text{Var}\left(R_{0}\right)=0.003546663\,\! }[/math]
From the above two values, the parameters of the prior distribution of the system reliability can be calculated by:
- [math]\displaystyle{ \alpha_{0}=E\left(R_{0}\right)\left[\frac{E\left(R_{0}\right)-E^{2}\left(R_{0}\right)}{\text{Var}\left(R_{0}\right)}-1\right]=30.12337003\,\! }[/math]
- [math]\displaystyle{ \beta_{0}=\left(1-E \left(R_{0}\right)\right)\left[\frac{E\left(R_{0}\right)-E^{2}\left(R_{0}\right)}{Var \left(R_{0}\right)}-1\right]=5.448499634\,\! }[/math]
With this prior distribution, we now can design a system reliability demonstration test by calculating system reliability R, confidence level CL, number of units n or number of failures r, as needed.
Solve for Sample Size n
Given the above subsystem test information, in order to demonstrate the system reliability of 0.9 at a confidence level of 0.8, how many samples are needed in the test? Assume the allowed number of failures is 1.
Using Weibull++, the results are given in the figure below. The result shows that at least 49 test units are needed.

