Growth Plan for Seven Phases
New format available! This reference is now available in a new format that offers faster page load, improved display for calculations and images and more targeted search.
As of January 2024, this Reliawiki page will not continue to be updated. Please update all links and bookmarks to the latest references at RGA examples and RGA reference examples.
This example appears in the Reliability Growth and Repairable System Analysis Reference.
The reliability team of a product manufacturer is putting together a reliability growth plan for one of the new products under design. The team wants to create an overall reliability growth plan based on the Crow Extended model. The inputs to the model are the following:
- The requirement or goal MTBF is [math]\displaystyle{ {{M}_{G}}=100\,\! }[/math] hours.
- The growth potential design margin factor is [math]\displaystyle{ GPDM=1.15\,\! }[/math].
- The average effectiveness factor is [math]\displaystyle{ d=0.6,\,\! }[/math] based on historical information for similar products developed by the company.
- The management strategy is [math]\displaystyle{ msr=0.90\,\! }[/math].
- The beta parameter for the discovery function, [math]\displaystyle{ h\left( t \right),\,\! }[/math] of the type B failure modes is [math]\displaystyle{ \beta =0.71\,\! }[/math], based on a data analysis of the previous product development project that was of similar nature.
- The test will be conducted in seven phases. The cumulative phase end times are [math]\displaystyle{ {{T}_{1}}=4000,{{T}_{2}}=8000\,\! }[/math], [math]\displaystyle{ {{T}_{3}}=12000,\,\! }[/math] [math]\displaystyle{ {{T}_{4}}=20000,\,\! }[/math] [math]\displaystyle{ {{T}_{5}}=25000,\,\! }[/math] [math]\displaystyle{ {{T}_{6}}=30000\,\! }[/math] and [math]\displaystyle{ {{T}_{7}}=40000\,\! }[/math] hours. The average fix delay for each phase is one week.
- For the first two phases, the plan is to test 1,000 hours per week, so the average fix delay in terms of test hours for phases 1 and 2 is [math]\displaystyle{ {{L}_{1}}=1000\,\! }[/math] and [math]\displaystyle{ {{L}_{2}}=1000\,\! }[/math] hours.
- For phases 3 and 4, the prototype test units are planned to be doubled, so the average fix delay in terms of test hours within one week is also going to be doubled, so we have: [math]\displaystyle{ {{L}_{3}}=2000\,\! }[/math] and [math]\displaystyle{ {{L}_{4}}=2000\,\! }[/math] hours.
- For phases 5 and 6, a second shift is going to be added, so the amount of test hours within a week is going to be doubled again. Therefore, the average fix delay in terms of test hours within one week is also going to be doubled: [math]\displaystyle{ {{L}_{5}}=4000\,\! }[/math] and [math]\displaystyle{ {{L}_{6}}=4000\,\! }[/math] hours. ***For the last phase, more units and weekend shifts are planned to be added, so the total test hours within one week are going to be 6,000 hours. In accordance, the average fix delay in terms of test hours will be [math]\displaystyle{ {{L}_{7}}=6000\,\! }[/math] hours.
Determine the following: Construct a reliability growth plan using the RGA software and make sure that the goal MTBF can be met within the total test hours allocated for growth testing. If not, make necessary changes in the phase durations in order to meet the goal.
Solution
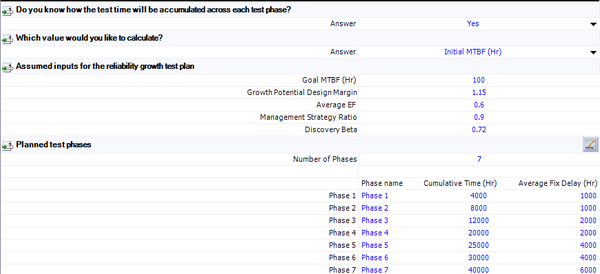
The following figure shows the planning inputs in RGA's continuous growth planning folio.
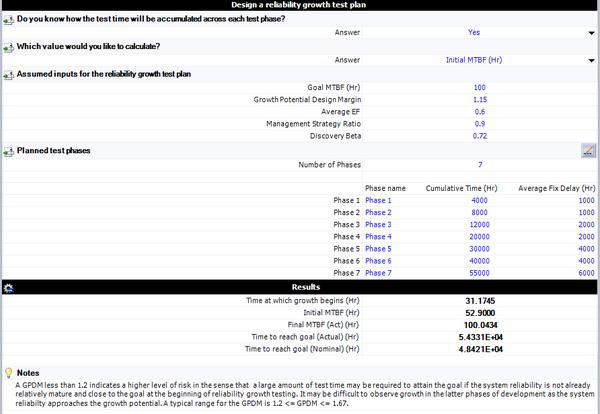
The next figure shows the planning calculations based on the goal MTBF of 100 hours and the rest of the known inputs into the model. As seen by the planning calculation results, the final actual MTBF at the end of the seventh phase is 98.66 hours, which is less than the MTBF goal of 100 hours.
Also, the next figure shows that the nominal time to meet the MTBF goal is 48,420 hours, which is higher than the total test time that is currently planned to be allocated for reliability growth.
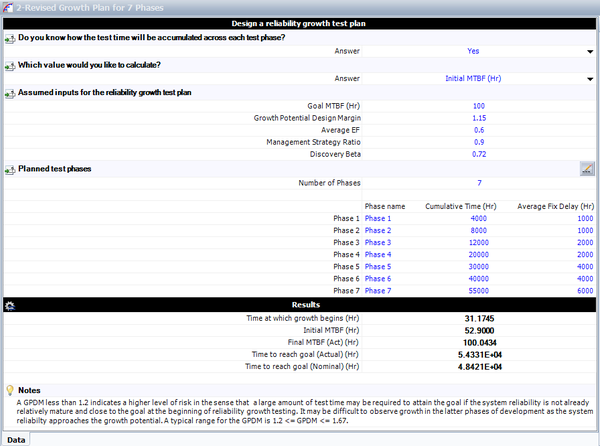
A new plan needs to be considered. The reliability team decides to increase the test time for phases 5 and 6 to be 10,000 hours each, instead of the 5,000 hours that were considered in the initial plan. Also, the team decides to increase the duration of the 7th phase to 15,000 hours. Since this is going to be achieved by testing for more calendar time in phases 5, 6 and 7, the average fix delay during those phases is the same as the one in the initial plan. The test time per week is not going to be affected, only more weeks will be added to the schedule. The next figure shows the revised plan, together with the calculated results. The actual time to meet the MTBF goal is now 54,331 hours. The final MTBF that can be achieved at the end of the 55,000 hours of growth testing is 100.04, which is slightly higher than the goal MTBF of 100 hours. The reliability team considers this plan as acceptable, since the MTBF goal will be met.
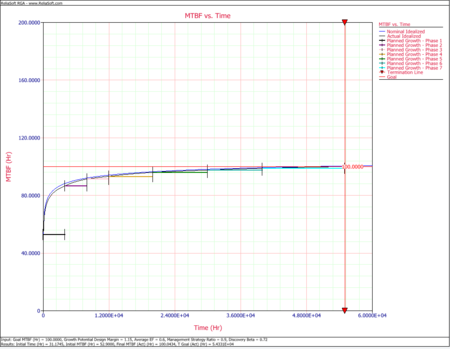
The next plot shows the overall reliability growth plan, with the nominal and actual growth curves, the MTBF goal line and the planned MTBF for each of the seven phases.


