Crow Extended Model for Repairable Systems Analysis Example: Difference between revisions
Chris Kahn (talk | contribs) No edit summary |
No edit summary |
||
| Line 1: | Line 1: | ||
<noinclude>{{Banner RGA Examples}} | <noinclude>{{Banner RGA Examples}} | ||
''This example appears in the [[Repairable_Systems_Analysis|Reliability Growth and Repairable System Analysis Reference | ''This example appears in the [[Repairable_Systems_Analysis|Reliability Growth and Repairable System Analysis Reference]]''. | ||
</noinclude> | </noinclude> | ||
| Line 8: | Line 8: | ||
#Calculate the projected MTBF after the delayed fixes. | #Calculate the projected MTBF after the delayed fixes. | ||
#If no fixes were performed for the future failures, what would be the expected number of failures at time 1,000? | #If no fixes were performed for the future failures, what would be the expected number of failures at time 1,000? | ||
'''Solution''' | '''Solution''' | ||
| Line 14: | Line 13: | ||
<li>The next figure shows the estimated Crow Extended parameters. | <li>The next figure shows the estimated Crow Extended parameters. | ||
[[Image:rga13.14.png | [[Image:rga13.14.png|center|600px]] | ||
</li> | </li> | ||
<li>The next figure shows the projected MTBF at time = 541 (i.e., the age of the oldest system). | <li>The next figure shows the projected MTBF at time = 541 (i.e., the age of the oldest system). | ||
[[Image:rga13.15.png | [[Image:rga13.15.png|center|450px]] | ||
</li> | </li> | ||
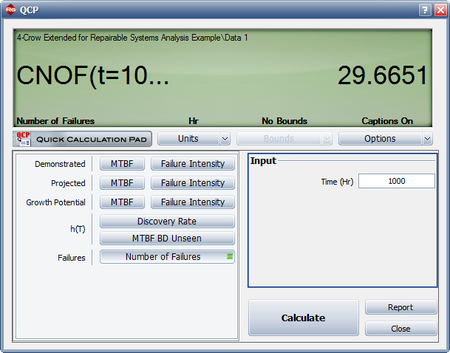
<li>The next figure shows the expected number of failures at time = 1,000. | <li>The next figure shows the expected number of failures at time = 1,000. | ||
[[Image:rga13.16.png | [[Image:rga13.16.png|center|450px]] | ||
</li> | </li> | ||
</ol> | </ol> | ||
Revision as of 20:00, 2 June 2014
 |
New format available! This reference is now available in a new format that offers faster page load, improved display for calculations and images and more targeted search.
As of January 2024, this Reliawiki page will not continue to be updated. Please update all links and bookmarks to the latest references at RGA examples and RGA reference examples.
This example appears in the Reliability Growth and Repairable System Analysis Reference.
The failures and fixes of two repairable systems in the field are recorded. Both systems started operating from time 0. System 1 ends at time = 504 and system 2 ends at time = 541. All the BD modes are fixed at the end of the test. A fixed effectiveness factor equal to 0.6 is used. Answer the following questions:
- Estimate the parameters of the Crow Extended model.
- Calculate the projected MTBF after the delayed fixes.
- If no fixes were performed for the future failures, what would be the expected number of failures at time 1,000?
Solution
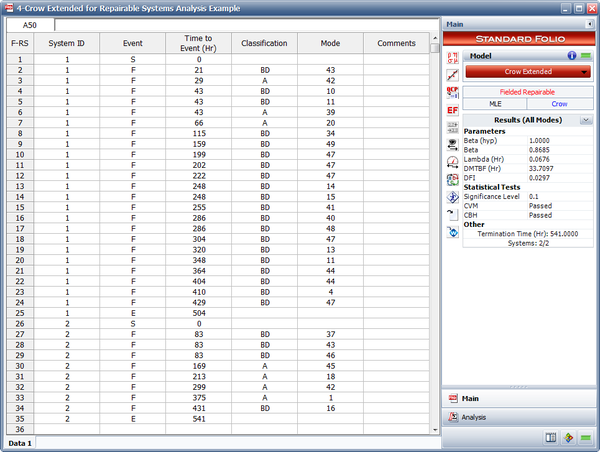
- The next figure shows the estimated Crow Extended parameters.
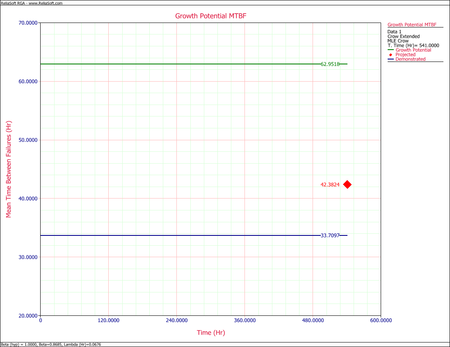
- The next figure shows the projected MTBF at time = 541 (i.e., the age of the oldest system).
- The next figure shows the expected number of failures at time = 1,000.