Template:Confidence bounds duane
Confidence Bounds
Least squares confidence bounds can be computed for both the model parameters and metrics of interest for the Duane model.
Parameter Bounds
Apply least squares analysis on the Duane model:
- [math]\displaystyle{ \ln ({{\hat{m}}_{c}})=\ln (b)+\alpha \ln (t) }[/math]
The unbiased estimator of can be obtained from:
- [math]\displaystyle{ {{\sigma }^{2}}=Var\left[ \ln {{m}_{c}}(t) \right]=\frac{SSE}{(n-2)} }[/math]
- where:
- [math]\displaystyle{ SSE=\underset{i=1}{\overset{n}{\mathop \sum }}\,{{\left[ \ln {{{\hat{m}}}_{c}}({{t}_{i}})-\ln {{m}_{c}}({{t}_{i}}) \right]}^{2}} }[/math]
Thus, the confidence bounds on [math]\displaystyle{ \alpha }[/math] and [math]\displaystyle{ b }[/math] are:
- [math]\displaystyle{ C{{B}_{\alpha }}=\hat{\alpha }\pm {{t}_{n-2,\alpha /2}}SE(\hat{\alpha }) }[/math]
- [math]\displaystyle{ C{{B}_{b}}=\hat{b}{{e}^{\pm {{t}_{n-2,\alpha /2}}SE\left[ \ln (\hat{b}) \right]}} }[/math]
where [math]\displaystyle{ {{t}_{n-2,\alpha /2}} }[/math] denotes the percentage point of the [math]\displaystyle{ t }[/math] distribution with [math]\displaystyle{ n-2 }[/math] degrees of freedom such that [math]\displaystyle{ P\{{{t}_{n-2}}\ge {{t}_{\alpha /2,n-2}}\}=\alpha /2 }[/math] and:
- [math]\displaystyle{ SE(\hat{\alpha })=\frac{\sigma }{\sqrt{{{S}_{xx}}}} }[/math]
- [math]\displaystyle{ SE\left[ \ln (\hat{b}) \right]=\sigma \cdot \sqrt{\frac{\underset{i=1}{\overset{n}{\mathop{\sum }}}\,{{(\ln {{t}_{i}})}^{2}}}{n\cdot {{S}_{xx}}}} }[/math]
- [math]\displaystyle{ {{S}_{xx}}=\left[ \underset{i=1}{\overset{n}{\mathop \sum }}\,{{(\ln {{t}_{i}})}^{2}} \right]-\frac{1}{n}{{\left( \underset{i=1}{\overset{n}{\mathop \sum }}\,\ln ({{t}_{i}}) \right)}^{2}} }[/math]
Other Bounds
Confidence bounds also can be obtained on the cumulative MTBF and the cumulative failure intensity:
- [math]\displaystyle{ C{{B}_{{{m}_{c}}}}={{\hat{m}}_{c}}(t){{e}^{\pm {{z}_{\alpha }}\sqrt{Var\left[ \ln ({{{\hat{m}}}_{c}}) \right]}}} }[/math]
- [math]\displaystyle{ \begin{align} & {{[{{\lambda }_{c}}(t)]}_{L}}= & \frac{1}{{{[{{m}_{c}}(t)]}_{u}}} \\ & {{[{{\lambda }_{c}}(t)]}_{U}}= & \frac{1}{{{[{{m}_{c}}(t)]}_{l}}} \end{align} }[/math]
When [math]\displaystyle{ n }[/math] is large, the approximate [math]\displaystyle{ 100(1-\alpha )% }[/math] confidence bounds for instantaneous MTBF are given by:
- [math]\displaystyle{ \begin{align} & {{m}_{i}}{{(t)}_{L}}= & \frac{{{[{{m}_{c}}(t)]}_{L}}}{{\hat{\beta }}} \\ & {{m}_{i}}{{(t)}_{U}}= & \frac{{{[{{m}_{c}}(t)]}_{U}}}{{\hat{\beta }}} \end{align} }[/math]
and therefore, the confidence bounds on the instantaneous failure intensity are:
- [math]\displaystyle{ \begin{align} & {{[{{\lambda }_{i}}(t)]}_{L}}= & \frac{1}{{{[{{m}_{i}}(t)]}_{U}}} \\ & {{[{{\lambda }_{c}}(t)]}_{U}}= & \frac{1}{{{[{{m}_{i}}(t)]}_{L}}} \end{align} }[/math]
Example 5[math]\displaystyle{ {{\lambda }_{i}}(t)=\tfrac{1}{{{m}_{i}}(t)} }[/math]
For the data given in Table 4.3, calculate the 90% confidence bounds for:
- The parameters [math]\displaystyle{ \alpha\text{and} b }[/math].
- The cumulative and instantaneous failure intensity.
- The cumulative and instantaneous MTBF.
Solution
- 1. Using the values of [math]\displaystyle{ \widehat{b} }[/math] and [math]\displaystyle{ \widehat{\alpha } }[/math] estimated from the least squares analysis in Example 3:
- [math]\displaystyle{ \widehat{b}=1.9453 }[/math]
- [math]\displaystyle{ \widehat{\alpha}=0.6133 \lt br\gt Eqn. (duanec9) is: \lt br\gt ::\lt math\gt \begin{align} & {{S}_{xx}}= & 1400.9084-1301.4545 \\ & = & 99.4539 \end{align} }[/math]
Eqn. (duanec7) is:
- [math]\displaystyle{ \begin{align} & SE(\hat{\alpha })= & \frac{\sigma }{\sqrt{{{S}_{xx}}}} \\ & = & \frac{0.08428}{9.9727} \\ & = & 0.008452 \end{align} }[/math]
Eqn. (duanec8) is:
- [math]\displaystyle{ \begin{align} & SE(\ln \hat{b})= & \sigma \cdot \sqrt{\frac{\underset{i=1}{\overset{n}{\mathop{\sum }}}\,{{(\ln {{T}_{i}})}^{2}}}{n\cdot {{S}_{xx}}}} \\ & = & 0.065960 \end{align} }[/math]
Thus, 90% confidence bounds on parameter [math]\displaystyle{ \alpha }[/math] using Eqn. (duanec1) are:
- [math]\displaystyle{ \begin{align} & {{\alpha }_{L}}= & 0.602050 \\ & {{\alpha }_{U}}= & 0.624417 \end{align} }[/math]
And 90% confidence bounds on parameter [math]\displaystyle{ b }[/math] using Eqn. (duanec2) are:
- [math]\displaystyle{ \begin{align} & {{b}_{L}}= & 1.7831 \\ & {{b}_{U}}= & 2.1231 \end{align} }[/math]
- 2. The cumulative failure intensity is:
- [math]\displaystyle{ \begin{align} & {{\lambda }_{c}}= & \frac{1}{1.9453}\cdot {{22000}^{-0.6133}} \\ & = & 0.00111689 \end{align} }[/math]
And the instantaneous failure intensity is equal to:
- [math]\displaystyle{ \begin{align} & {{\lambda }_{i}}= & \frac{1}{1.9453}\cdot (1-0.6133)\cdot {{22000}^{-0.6133}} \\ & = & 0.00043198 \end{align} }[/math]
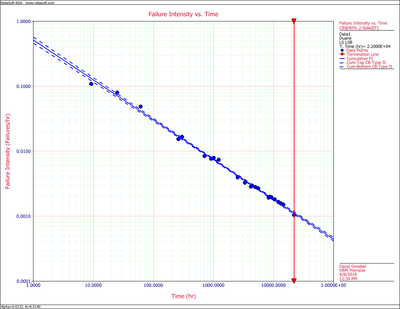
So, at the 90% confidence level and for [math]\displaystyle{ T=22,000 }[/math] hr, the confidence bounds on cumulative failure intensity are:
- [math]\displaystyle{ \begin{align} & {{[{{\lambda }_{c}}(t)]}_{L}}= & 0.00100254 \\ & {{[{{\lambda }_{c}}(t)]}_{U}}= & 0.00124429 \end{align} }[/math]
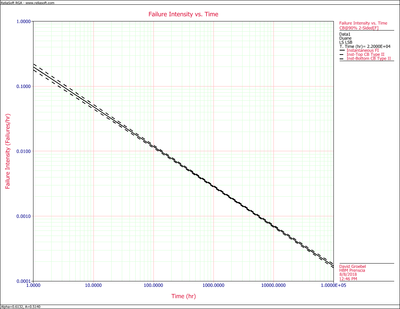
For the instantaneous failure intensity:
- [math]\displaystyle{ \begin{align} & {{[{{\lambda }_{i}}(t)]}_{L}}= & 0.00038775 \\ & {{[{{\lambda }_{c}}(t)]}_{U}}= & 0.00048125 \end{align} }[/math]
Figures figure75 and figure76 show the graphs of the cumulative and instantaneous failure intensity. Both are plotted with confidence bounds.
- 3. The cumulative MTBF is:
- [math]\displaystyle{ \begin{align} & {{m}_{c}}(T)= & 1.9453\cdot {{22000}^{0.6133}} \\ & = & 895.3395 \end{align} }[/math]
And the instantaneous MTBF is:
- [math]\displaystyle{ \begin{align} & {{m}_{i}}(T)= & \frac{1.9453}{1-0.6133}\cdot {{22000}^{0.6133}} \\ & = & 2314.9369 \end{align} }[/math]
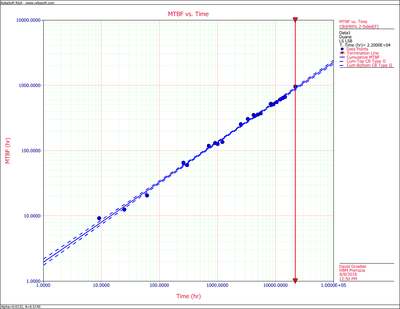
So, at 90% confidence level and for [math]\displaystyle{ T=22,000 }[/math] hr, the confidence bounds on the cumulative MTBF are:
- [math]\displaystyle{ \begin{align} & {{m}_{c}}{{(t)}_{l}}= & 803.6695 \\ & {{m}_{c}}{{(t)}_{u}}= & 997.4658 \end{align} }[/math]
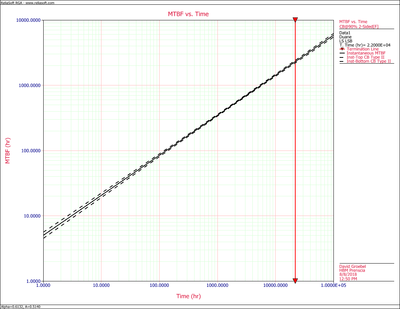
The confidence bounds for the instantaneous MTBF are:
- [math]\displaystyle{ \begin{align} & {{m}_{i}}{{(t)}_{l}}= & 2077.9204 \\ & {{m}_{i}}{{(t)}_{u}}= & 2578.9886 \end{align} }[/math]
Figure CumMTBFCB displays the cumulative MTBF while Figure InstMTBFCB displays the instantaneous MTBF. Both are plotted with confidence bounds.


