A health care company maintains five identical pieces of equipment used by a hospital. When a piece of equipment fails, the company sends a crew to repair it. The following table gives the failure and censoring ages for each machine, where the + sign indicates a censoring age.
[math]\displaystyle{ \begin{matrix}
Equipment ID & Months \\
\text{1} & \text{5, 10 , 15, 17+} \\
\text{2} & \text{6, 13, 17, 19+} \\
\text{3} & \text{12, 20, 25, 26+} \\
\text{4} & \text{13, 15, 24+} \\
\text{5} & \text{16, 22, 25, 28+} \\
\end{matrix}\,\! }[/math]
Estimate the MCF values, with 95% confidence bounds.
Solution
The MCF estimates are obtained as follows:
[math]\displaystyle{ \begin{matrix}
ID & Months ({{t}_{i}}) & State & {{r}_{i}} & 1/{{r}_{i}} & {{M}^{*}}({{t}_{i}}) \\
\text{1} & \text{5} & \text{F} & \text{5} & \text{0}\text{.20} & \text{0}\text{.20} \\
\text{2} & \text{6} & \text{F} & \text{5} & \text{0}\text{.20} & \text{0}\text{.20 + 0}\text{.20 = 0}\text{.40} \\
\text{1} & \text{10} & \text{F} & \text{5} & \text{0}\text{.20} & \text{0}\text{.40 + 0}\text{.20 = 0}\text{.60} \\
\text{3} & \text{12} & \text{F} & \text{5} & \text{0}\text{.20} & \text{0}\text{.60 + 0}\text{.20 = 0}\text{.80} \\
\text{2} & \text{13} & \text{F} & \text{5} & \text{0}\text{.20} & \text{0}\text{.80 + 0}\text{.20 = 1}\text{.00} \\
\text{4} & \text{13} & \text{F} & \text{5} & \text{0}\text{.20} & \text{1}\text{.00 + 0}\text{.20 = 1}\text{.20} \\
\text{1} & \text{15} & \text{F} & \text{5} & \text{0}\text{.20} & \text{1}\text{.20 + 0}\text{.20 = 1}\text{.40} \\
\text{4} & \text{15} & \text{F} & \text{5} & \text{0}\text{.20} & \text{1}\text{.40 + 0}\text{.20 = 1}\text{.60} \\
\text{5} & \text{16} & \text{F} & \text{5} & \text{0}\text{.20} & \text{1}\text{.60 + 0}\text{.20 = 1}\text{.80} \\
\text{2} & \text{17} & \text{F} & \text{5} & \text{0}\text{.20} & \text{1}\text{.80 + 0}\text{.20 = 2}\text{.00} \\
\text{1} & \text{17} & \text{S} & \text{4} & {} & {} \\
\text{2} & \text{19} & \text{S} & \text{3} & {} & {} \\
\text{3} & \text{20} & \text{F} & \text{3} & \text{0}\text{.33} & \text{2}\text{.00 + 0}\text{.33 = 2}\text{.33} \\
\text{5} & \text{22} & \text{F} & \text{3} & \text{0}\text{.33} & \text{2}\text{.33 + 0}\text{.33 = 2}\text{.66} \\
\text{4} & \text{24} & \text{S} & \text{2} & {} & {} \\
\text{3} & \text{25} & \text{F} & \text{2} & \text{0}\text{.50} & \text{2}\text{.66 + 0}\text{.50 = 3}\text{.16} \\
\text{5} & \text{25} & \text{F} & \text{2} & \text{0}\text{.50} & \text{3}\text{.16 + 0}\text{.50 = 3}\text{.66} \\
\text{3} & \text{26} & \text{S} & \text{1} & {} & {} \\
\text{5} & \text{28} & \text{S} & \text{0} & {} & {} \\
\end{matrix}\,\! }[/math]
Using the MCF variance equation, the following table of variance values can be obtained:
| ID
|
Months
|
State
|
[math]\displaystyle{ {{r}_{i}}\,\! }[/math]
|
[math]\displaystyle{ Va{{r}_{i}}\,\! }[/math]
|
| 1
|
5
|
F
|
5
|
[math]\displaystyle{ (\tfrac{1}{5})^2[(1-\tfrac{1}{5})^2+4(0-\tfrac{1}{5})^2]=0.032\,\! }[/math]
|
| 2
|
6
|
F
|
5
|
[math]\displaystyle{ 0.032+(\tfrac{1}{5})^2[(1-\tfrac{1}{5})^2+4(0-\tfrac{1}{5})^2]=0.064\,\! }[/math]
|
| 1
|
10
|
F
|
5
|
[math]\displaystyle{ 0.064+(\tfrac{1}{5})^2[(1-\tfrac{1}{5})^2+4(0-\tfrac{1}{5})^2]=0.096\,\! }[/math]
|
| 3
|
12
|
F
|
5
|
[math]\displaystyle{ 0.096+(\tfrac{1}{5})^2[(1-\tfrac{1}{5})^2+4(0-\tfrac{1}{5})^2]=0.128\,\! }[/math]
|
| 2
|
13
|
F
|
5
|
[math]\displaystyle{ 0.128+(\tfrac{1}{5})^2[(1-\tfrac{1}{5})^2+4(0-\tfrac{1}{5})^2]=0.160\,\! }[/math]
|
| 4
|
13
|
F
|
5
|
[math]\displaystyle{ 0.160+(\tfrac{1}{5})^2[(1-\tfrac{1}{5})^2+4(0-\tfrac{1}{5})^2]=0.192\,\! }[/math]
|
| 1
|
15
|
F
|
5
|
[math]\displaystyle{ 0.192+(\tfrac{1}{5})^2[(1-\tfrac{1}{5})^2+4(0-\tfrac{1}{5})^2]=0.224\,\! }[/math]
|
| 4
|
15
|
F
|
5
|
[math]\displaystyle{ 0.224+(\tfrac{1}{5})^2[(1-\tfrac{1}{5})^2+4(0-\tfrac{1}{5})^2]=0.256\,\! }[/math]
|
| 5
|
16
|
F
|
5
|
[math]\displaystyle{ 0.256+(\tfrac{1}{5})^2[(1-\tfrac{1}{5})^2+4(0-\tfrac{1}{5})^2]=0.288\,\! }[/math]
|
| 2
|
17
|
F
|
5
|
[math]\displaystyle{ 0.288+(\tfrac{1}{5})^2[(1-\tfrac{1}{5})^2+4(0-\tfrac{1}{5})^2]=0.320\,\! }[/math]
|
| 1
|
17
|
S
|
4
|
|
| 2
|
19
|
S
|
3
|
|
| 3
|
20
|
F
|
3
|
[math]\displaystyle{ 0.320+(\tfrac{1}{3})^2[(1-\tfrac{1}{3})^2+2(0-\tfrac{1}{3})^2]=0.394\,\! }[/math]
|
| 5
|
22
|
F
|
3
|
[math]\displaystyle{ 0.394+(\tfrac{1}{3})^2[(1-\tfrac{1}{3})^2+2(0-\tfrac{1}{3})^2]=0.468\,\! }[/math]
|
| 4
|
24
|
S
|
2
|
|
| 3
|
25
|
F
|
2
|
[math]\displaystyle{ 0.468+(\tfrac{1}{2})^2[(1-\tfrac{1}{2})^2+(0-\tfrac{1}{2})^2]=0.593\,\! }[/math]
|
| 5
|
25
|
F
|
2
|
[math]\displaystyle{ 0.593+(\tfrac{1}{2})^2[(1-\tfrac{1}{2})^2+(0-\tfrac{1}{2})^2]=0.718\,\! }[/math]
|
| 3
|
26
|
S
|
1
|
|
| 5
|
28
|
S
|
0
|
|
Using the equation for the MCF bounds and [math]\displaystyle{ {{K}_{5}} = 1.644\,\! }[/math] for a 95% confidence level, the confidence bounds can be obtained as follows:
[math]\displaystyle{ \begin{matrix}
ID & Months & State & MC{{F}_{i}} & Va{{r}_{i}} & MC{{F}_{{{L}_{i}}}} & MC{{F}_{{{U}_{i}}}} \\
\text{1} & \text{5} & \text{F} & \text{0}\text{.20} & \text{0}\text{.032} & 0.0459 & 0.8709 \\
\text{2} & \text{6} & \text{F} & \text{0}\text{.40} & \text{0}\text{.064} & 0.1413 & 1.1320 \\
\text{1} & \text{10} & \text{F} & \text{0}\text{.60} & \text{0}\text{.096} & 0.2566 & 1.4029 \\
\text{3} & \text{12} & \text{F} & \text{0}\text{.80} & \text{0}\text{.128} & 0.3834 & 1.6694 \\
\text{2} & \text{13} & \text{F} & \text{1}\text{.00} & \text{0}\text{.160} & 0.5179 & 1.9308 \\
\text{4} & \text{13} & \text{F} & \text{1}\text{.20} & \text{0}\text{.192} & 0.6582 & 2.1879 \\
\text{1} & \text{15} & \text{F} & \text{1}\text{.40} & \text{0}\text{.224} & 0.8028 & 2.4413 \\
\text{4} & \text{15} & \text{F} & \text{1}\text{.60} & \text{0}\text{.256} & 0.9511 & 2.6916 \\
\text{5} & \text{16} & \text{F} & \text{1}\text{.80} & \text{0}\text{.288} & 1.1023 & 2.9393 \\
\text{2} & \text{17} & \text{F} & \text{2}\text{.00} & \text{0}\text{.320} & 1.2560 & 3.1848 \\
\text{1} & \text{17} & \text{S} & {} & {} & {} & {} \\
\text{2} & \text{19} & \text{S} & {} & {} & {} & {} \\
\text{3} & \text{20} & \text{F} & \text{2}\text{.33} & \text{0}\text{.394} & 1.4990 & 3.6321 \\
\text{5} & \text{22} & \text{F} & \text{2}\text{.66} & \text{0}\text{.468} & 1.7486 & 4.0668 \\
\text{4} & \text{24} & \text{S} & {} & {} & {} & {} \\
\text{3} & \text{25} & \text{F} & \text{3}\text{.16} & \text{0}\text{.593} & 2.1226 & 4.7243 \\
\text{5} & \text{25} & \text{F} & \text{3}\text{.66} & \text{0}\text{.718} & 2.5071 & 5.3626 \\
\text{3} & \text{26} & \text{S} & {} & {} & {} & {} \\
\text{5} & \text{28} & \text{S} & {} & {} & {} & {} \\
\end{matrix}\,\! }[/math]
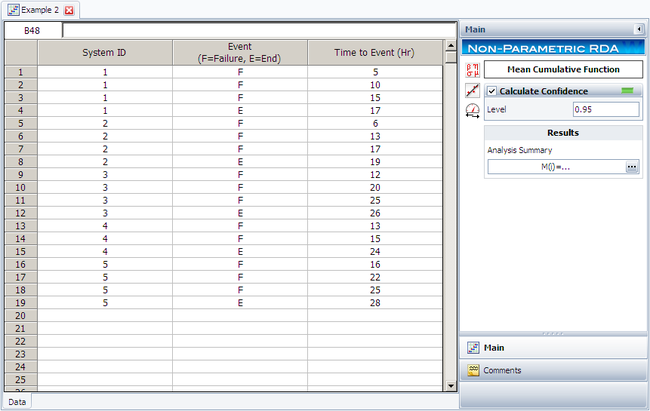
The analysis presented in this example can be performed automatically in Weibull++'s non-parametric RDA folio, as shown next.
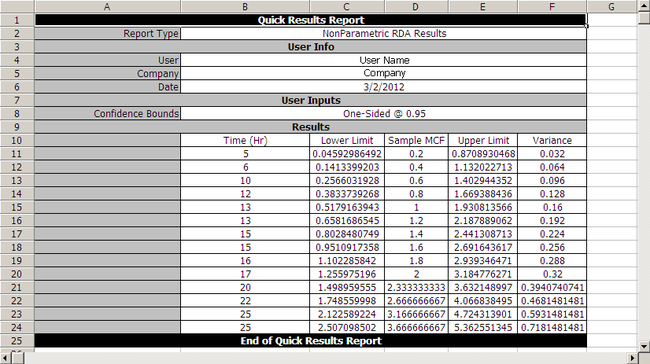
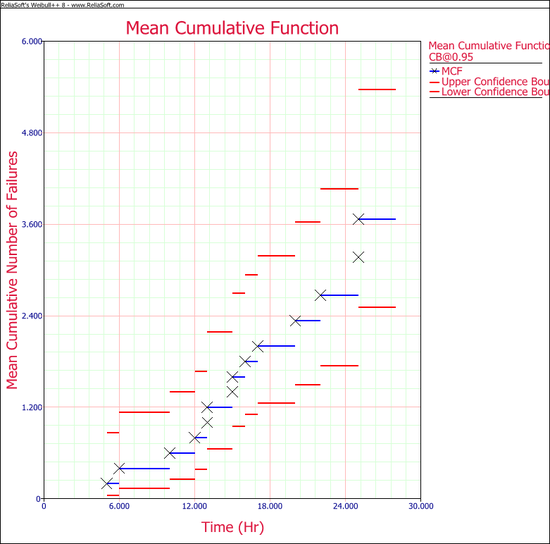
Note: In the folio above, the [math]\displaystyle{ F\,\! }[/math] refers to failures and [math]\displaystyle{ E\,\! }[/math] refers to suspensions (or censoring ages). The results, with calculated MCF values and upper and lower 95% confidence limits, are shown next along with the graphical plot.


