Template:Example: Test Design Using Expected Failure Times Plot: Difference between revisions
Jump to navigation
Jump to search
(Created page with ''''Test Design Using Expected Failure Times Plot''' Four units were allocated for a reliability test. The test engineers want to know how long the test will last if all the unit…') |
No edit summary |
||
| Line 1: | Line 1: | ||
'''Test Design Using Expected Failure Times Plot''' | '''Test Design Using Expected Failure Times Plot''' | ||
Four units were allocated for a reliability test. The test engineers want to know how long the test will last if all the units are tested to failure. Based on previous experiments, they assume the underlying failure distribution is a Weibull distribution with <math>\beta</ | Four units were allocated for a reliability test. The test engineers want to know how long the test will last if all the units are tested to failure. Based on previous experiments, they assume the underlying failure distribution is a Weibull distribution with <math>\beta</math> = 2 and <math>\eta</math> = 500. | ||
Revision as of 17:51, 24 February 2012
Test Design Using Expected Failure Times Plot
Four units were allocated for a reliability test. The test engineers want to know how long the test will last if all the units are tested to failure. Based on previous experiments, they assume the underlying failure distribution is a Weibull distribution with [math]\displaystyle{ \beta }[/math] = 2 and [math]\displaystyle{ \eta }[/math] = 500.
Solution
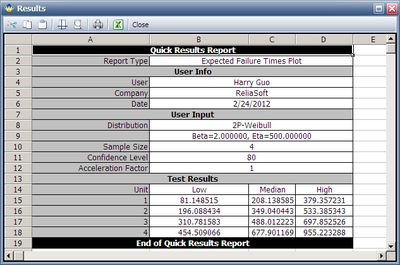
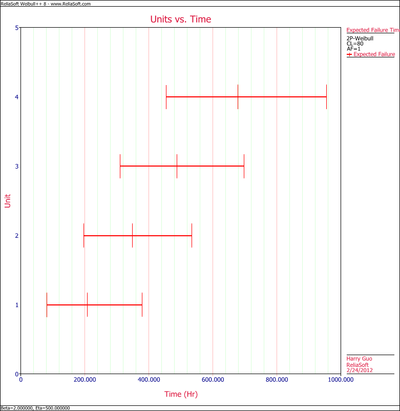
The expected failure time with 80% 2-sided confidence bounds are given below.

